Every time crypto crashes, the Fear and Greed Index becomes the centre of attention. Headlines reference it. Analysts cite it. Traders use it to justify both buying and avoiding the market.
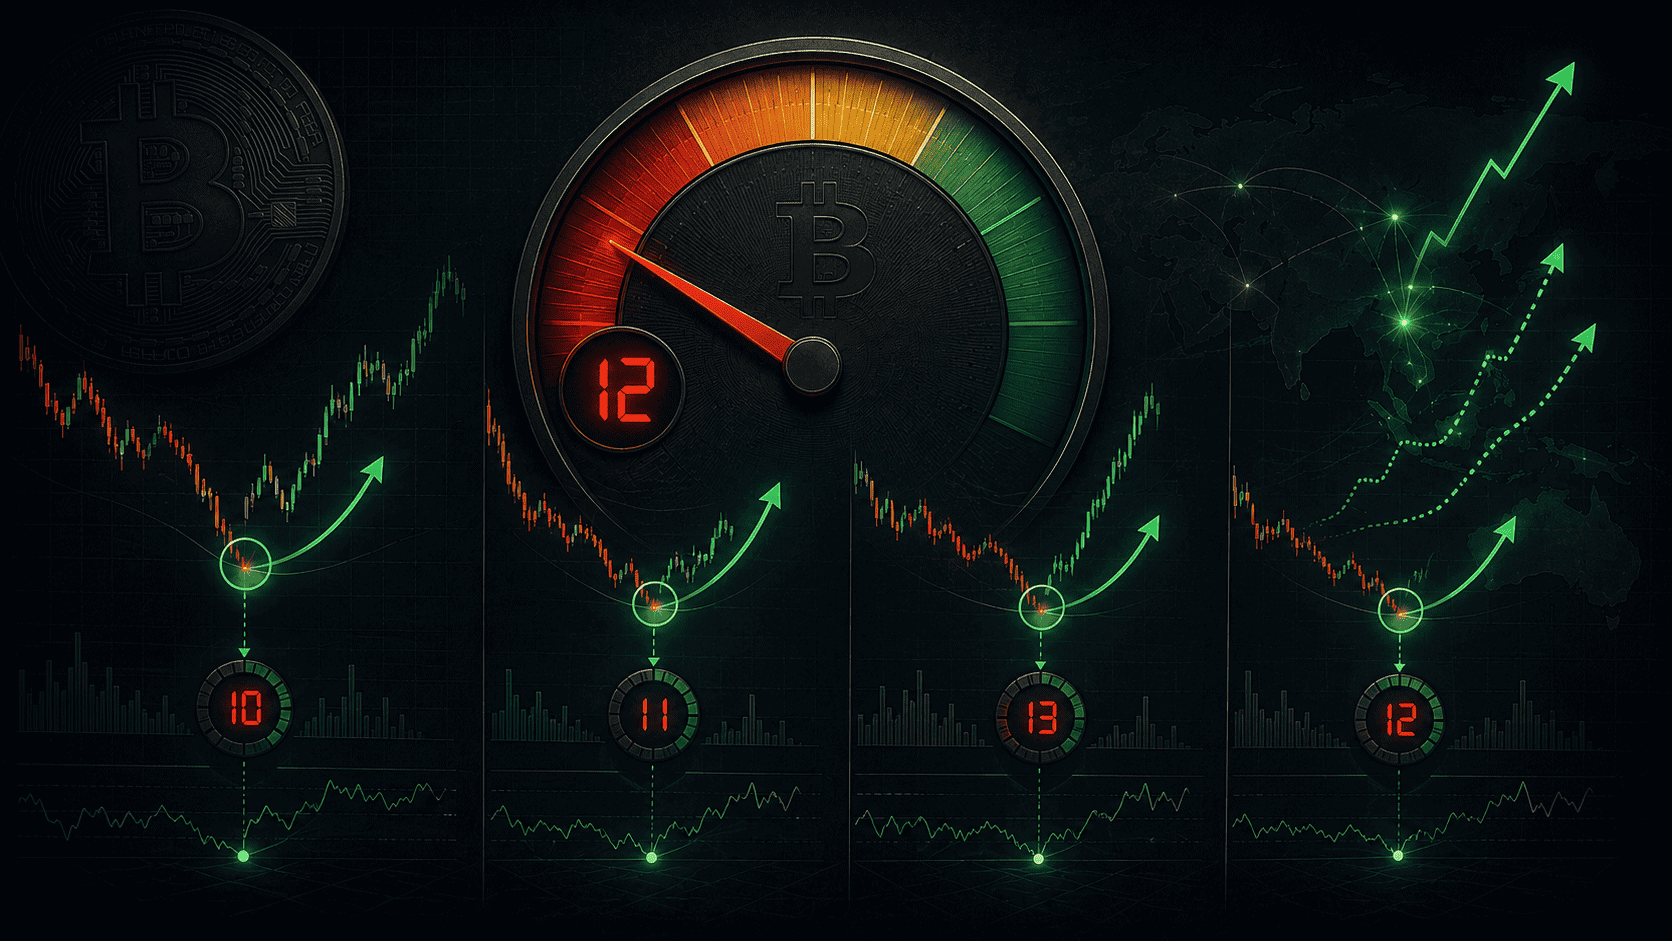
In June 2026, the index hit 12. It’s the lowest reading of the year and among the lowest in the indicator’s entire history. Bitcoin is at $62,500. Ethereum is at $1,627. The market has been in extreme fear for weeks. And the question every investor is asking is the same one that’s asked at every extreme reading: is this the bottom or just the beginning of something worse?


The honest answer is that the Fear and Greed Index gives you probability, not certainty. Readings this low have preceded some of the most powerful rallies in crypto history. They’ve also preceded further declines that lasted months. Understanding when the indicator is signalling a generational opportunity versus when it’s signalling “still falling” is the difference between buying near a bottom and catching a falling knife.
This guide breaks down what the index measures, what extreme readings have meant historically, and how to use it without falling into the trap of buying every dip.
What the Index Actually Measures
The Crypto Fear and Greed Index is a composite metric that aggregates five data sources into a single number between 0 and 100. A reading of 0 means absolute maximum fear. A reading of 100 means absolute maximum greed. The middle, around 50, indicates neutral sentiment.
The five components carry different weights and measure different aspects of market psychology.
Volatility (25% weight) compares current price volatility to the average over the past 30 and 90 days. Higher volatility, particularly during declines, indicates fear. The component captures whether the market is moving in orderly fashion or panicking.
Market momentum and volume (25% weight) compares current trading volume and momentum to recent averages. Heavy volume on declines indicates capitulation. Light volume on rallies indicates lack of conviction. Both push the index toward fear.
Social media (15% weight) analyses cryptocurrency-related posts, hashtag engagement, and sentiment across platforms. High volumes of negative sentiment push the index lower. Periods of euphoria push it higher.
Bitcoin dominance (10% weight) measures Bitcoin’s percentage of total crypto market cap. Rising dominance during selloffs indicates capital fleeing altcoins for BTC’s relative safety, which the index interprets as fear-driven flight to quality.
Surveys (15% weight) previously polled crypto users about their sentiment but have been paused. The component currently has reduced weight.
The composite produces a single number that’s classified into five zones: 0-24 (Extreme Fear), 25-49 (Fear), 50 (Neutral), 51-74 (Greed), 75-100 (Extreme Greed). The classifications give traders a quick read on market psychology without needing to interpret individual components.
The Historical Track Record at Extreme Lows
The Fear and Greed Index has produced some of crypto’s most reliable contrarian signals at extreme low readings. The track record at sub-15 readings is particularly notable.
November 2022, Index at 10. The FTX collapse pushed sentiment to one of its lowest readings ever. Bitcoin was trading at approximately $16,000. Over the following 35 months, BTC rallied to $126,000, a gain of nearly 700%.
May 2022, Index at 6. The Terra/Luna implosion produced the lowest reading in the index’s history. Bitcoin was at $27,000. The price continued falling to $16,000 over the following six months before the recovery began. The index correctly signalled extreme fear, but the bottom wasn’t reached for another five months.
June 2019, Index at 5. A pre-bull market reading that occurred during a quieter period. Bitcoin was at $3,500. The subsequent rally took BTC to $14,000 within months.
March 2020, Index at 8. The COVID crash produced extreme fear across all markets. Bitcoin briefly dipped to $4,000. The recovery to $65,000 over the following 13 months was one of the fastest in crypto history.
February 2026, Index at 15. The Iran-driven selloff brought Bitcoin to $60,000. The bounce was sharp, reaching $82,000 over the following two months.
The pattern is consistent but not uniform. Every reading below 15 has eventually been followed by a significant rally. The timing between the extreme reading and the actual bottom has varied from days (February 2026) to months (May 2022). The magnitude of the subsequent rally has ranged from 100% to over 700%.
When 12 Means Buy and When It Means Run
The current reading of 12 in June 2026 sits in territory that has historically been a buying signal. But the timing element is what makes the analysis difficult.
The “buy” signal applies most reliably when several conditions align with the extreme reading. The market has experienced significant capitulation through forced liquidations and selling. Long-term holders are accumulating rather than selling. Technical indicators are deeply oversold across multiple timeframes. The fundamental thesis for the asset hasn’t broken.
All of those conditions are present in June 2026. Over $5 billion in leveraged positions have been liquidated. Long-term Bitcoin holders control a record 15.8 million BTC. The RSI is in deeply oversold territory. Adoption infrastructure (ETFs, regulatory progress, institutional integration) continues expanding. By these criteria, the current reading of 12 looks like a buy signal.
The “run” signal applies when the extreme reading occurs alongside structural deterioration that the fear hasn’t fully priced in. The May 2022 example fits this pattern. The Terra/Luna collapse produced a reading of 6, but the underlying contagion through Celsius, Three Arrows Capital, and FTX hadn’t fully played out. Investors who bought at index 6 in May 2022 watched their positions decline another 40% before the actual bottom in November 2022.
The current cycle has elements that suggest more pain could come. Rate cuts have been removed from the Fed’s outlook. PPI inflation came in hot. The ETF outflow streak is the longest in history. Strategy has sold Bitcoin for the first time. These factors create the possibility that the macro environment continues to deteriorate even from extreme fear levels.
The honest assessment is that the index at 12 raises the probability of a near-term bottom but doesn’t guarantee one. The same reading has produced sharp bounces (February 2026, March 2020) and extended declines (May 2022) depending on the underlying conditions.
How to Use the Index Without Getting Burned
Several practical rules can help investors use the Fear and Greed Index without falling into common traps.
Rule 1: Treat extreme readings as probability shifts, not certainty signals. A reading of 12 doesn’t mean “buy now with everything you have.” It means the probability-weighted return over a 12 to 24 month horizon is favourable. Position sizing should reflect that probability shift, not a certainty trade.
Rule 2: Combine the index with technical and on-chain data. The index alone isn’t enough. Pair it with RSI readings, long-term holder behaviour, ETF flows, and fundamental developments. When multiple independent indicators all point to capitulation, the probability of a bottom increases. When the index is extreme but on-chain data shows continued distribution, the bottom may not be in.
Rule 3: Use dollar-cost averaging at extreme readings, not lump sums. Extreme fear can persist for weeks or months. Spreading purchases across the period of extreme readings reduces the risk of buying just before further declines. If you decide to allocate $10,000 at index 15, consider deploying $2,500 weekly over four weeks rather than $10,000 in a single day.
Rule 4: Never use the index to time short-term trades. The signal operates on multi-month timeframes. Using it to predict next week’s price action will produce inconsistent results. The index tells you about probability over months and years, not days and weeks.
Rule 5: Watch for divergences. When the index shows extreme fear but price stops falling, that divergence is often the actual bottom signal. The market reaches a point where further selling produces no further decline, indicating that the seller exhaustion the index has been measuring is complete.
Rule 6: Consider what the index isn’t measuring. The index doesn’t capture macro conditions like Fed policy, geopolitical risk, or regulatory developments. A reading of 12 with a hawkish Fed and active geopolitical crisis is fundamentally different from a reading of 12 with a dovish Fed and resolved geopolitics. Always consider the broader environment.
What the Greed Side Looks Like
Understanding extreme greed is just as important as understanding extreme fear, because both extremes provide contrarian signals.
The index has hit extreme greed readings above 85 multiple times during major rallies. October 2021 saw readings near 90 as Bitcoin reached its previous all-time high near $69,000. November 2024 produced readings above 80 as Bitcoin pushed toward $99,000. October 2025 saw readings near 85 as Bitcoin reached its $126,000 all-time high.
Each of those extreme greed readings was followed by significant corrections. The 2021 reading preceded a decline from $69,000 to $15,500. The 2024 reading preceded a 25% pullback. The 2025 reading preceded the current correction that took Bitcoin from $126,000 to $62,500.
The rules for extreme greed are inverse to the rules for extreme fear. When everyone is euphoric, the smart money begins selling. When social media is filled with predictions of $200,000 or $500,000 Bitcoin, the probability of a near-term top increases. The index above 85 doesn’t mean “sell everything immediately,” but it suggests reducing risk and taking partial profits.
The most successful crypto investors have used the Fear and Greed Index as a portfolio rebalancing tool rather than a market timing tool. Accumulating in extreme fear zones and reducing positions in extreme greed zones produces better risk-adjusted returns than holding through full cycles or trying to time exact tops and bottoms.
The Bottom Line on Index 12
At its current reading, the index is signalling that crypto markets are as fearful as they’ve been in the entire cycle. Historical patterns suggest buying at this level produces strong returns over 12 to 24 month horizons. The conditions that have accompanied previous bottoms (long-term holder accumulation, technical oversold readings, capitulation through liquidations) are all present.
But timing the exact bottom remains impossible. The macro environment carries genuine risks that could extend the decline. The FOMC meeting on June 17-18 is the next major catalyst. The CLARITY Act, ETF flow reversal, and resolution of the Iran conflict could all shift the picture in either direction.
For long-term investors, the current reading provides one of the better entry opportunities of the cycle. For traders trying to call the exact bottom, the index alone won’t give you the precision you need.
The indicator measures sentiment. Sentiment is one input among many. Use it as a probability tool, not a crystal ball.
FAQ
What does a Fear and Greed Index reading of 12 mean?
A reading of 12 indicates extreme fear across crypto markets. It’s the lowest reading of 2026 and among the lowest in the indicator’s history. Previous readings below 15 have historically preceded significant rallies, though the timing between the extreme reading and the actual bottom has varied from days to months.
Has the Fear and Greed Index ever been wrong?
The index correctly identified extreme fear during the May 2022 Terra/Luna collapse with a reading of 6, but Bitcoin continued falling for another five months before the actual bottom. The signal was accurate about extreme fear but the timing of the recovery was much later than the extreme reading suggested. Investors who bought immediately at index 6 watched their positions decline another 40% before the eventual rally.
Should I buy crypto when the index is at extreme fear?
Extreme fear readings have historically produced favourable returns over 12 to 24 month horizons, making them strong entry points for long-term investors. However, the timing of the actual bottom can be days, weeks, or months away from the extreme reading. Dollar-cost averaging into positions during extreme fear periods produces better results than deploying all capital at a single extreme reading.
Disclaimer: This article is for informational purposes only and does not constitute financial advice. Cryptocurrency investments carry significant risk. Always conduct your own research before making any investment decisions.