Bitcoin has now bumped its head on the same ceiling three times. On Tuesday, it briefly touched $76,000 before sliding back below $75,000. It did the same thing the week before. And the week before that. Each time, the rally has looked promising from below and disappointed from above. The pattern is consistent enough that it deserves an explanation, and today the on-chain data is offering one.
Bitcoin currently trades around $74,362, up nearly 10% for the month of April but completely unable to hold above the $75,000 level that has now rejected it three consecutive times. US stock markets, by contrast, just posted record highs. The Nasdaq has logged ten winning sessions in a row. The divergence is telling a story about what is happening specifically inside Bitcoin’s market structure right now.


The $76,800 Breakeven Problem
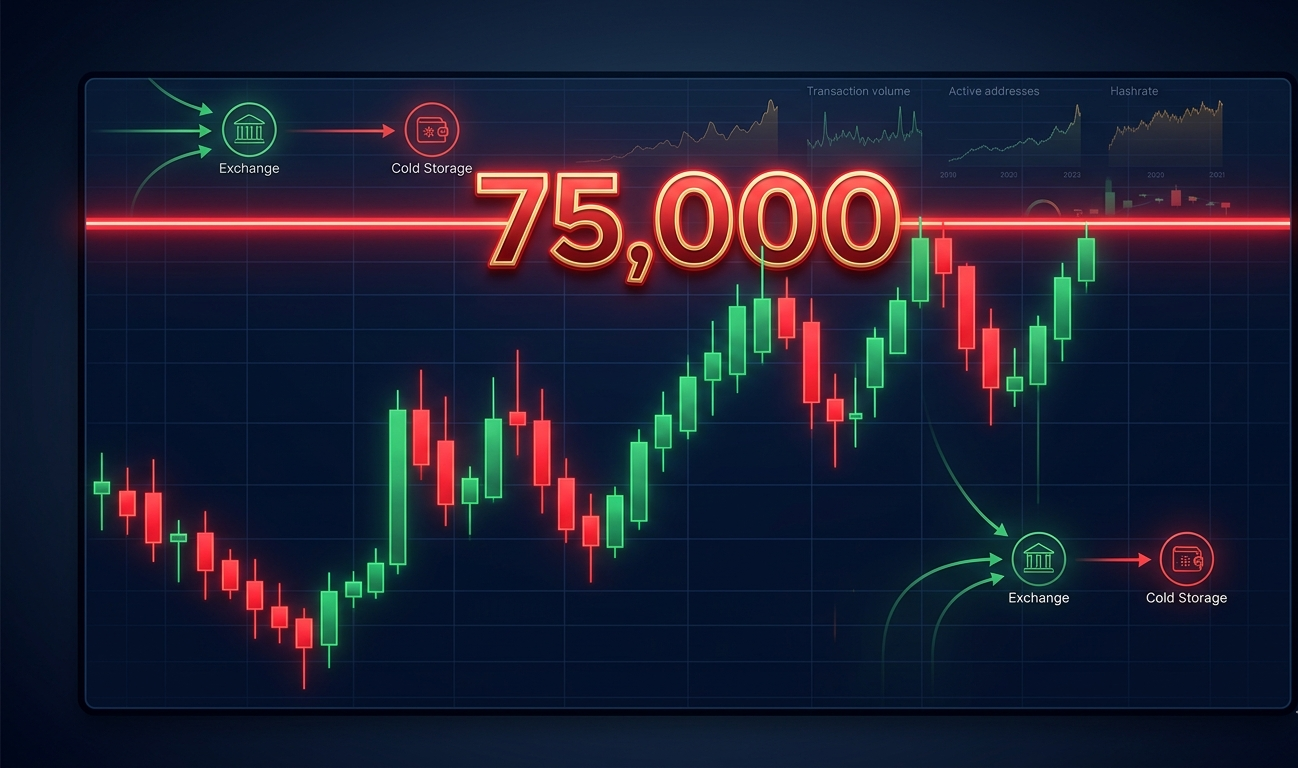
As prices near about $76,800, on-chain data shows a sharp increase in exchange deposits from larger holders, suggesting many are selling at or near their breakeven levels. This is the core of the issue. When Bitcoin was falling earlier this year, a large cohort of traders bought in at prices between $75,000 and $77,000. Those buyers are now underwater or barely breaking even. As the price approaches their entry point, the most natural thing in the world happens: they sell. Not because they are bearish, but because they bought near the top and now have an exit.
Around $76,800 sits the so-called realized price for recent buyers, effectively the average entry point for traders who accumulated during the last phase of the drawdown, according to CryptoQuant. In weaker market regimes, that level has often acted as resistance, as investors who were previously underwater use rallies to exit at breakeven. The same band capped January’s bounce almost to the dollar before prices reversed toward $60,000.
January is worth dwelling on. Bitcoin rallied sharply in January, hit exactly this same zone, and then fell to $60,000. The on-chain data is showing the same setup again today.
A Billion Dollars in Profits Taken in One Day
The numbers from Tuesday’s spike toward $76,000 were striking. Profit-taking was particularly strong on Tuesday as Bitcoin briefly climbed toward $76,000 before quickly slipping back below $75,000. According to CryptoQuant, investors realized about $1.14 billion in profits during the move, one of the largest single-day readings this year.
To put that in plain terms: as Bitcoin climbed toward $76,000, holders moved roughly $1.14 billion worth of coins onto exchanges or into profit-taking transactions in a single day. That is an enormous amount of sell pressure for any market to absorb. The buyers available, primarily ETF inflows and macro-driven institutional demand, were large enough to push the price up but not large enough to keep it there once that volume of selling emerged.
CryptoQuant said Bitcoin exchange inflows spiked to roughly 11,000 BTC per hour, the highest since late December, as prices tested the $75,000 to $76,000 range. At the same time, the average deposit size rose to about 2.25 BTC, the highest daily reading since mid-2024, suggesting that larger holders are driving the move.
The deposit size detail matters. This is not small retail sellers hitting the exits. These are larger holders, making bigger transactions, choosing this specific price zone to reduce their exposure. That is a more stubborn source of resistance than panic selling, because it is deliberate and will likely continue every time the price approaches the same level.
What Is Holding Bitcoin Up
The flip side of this story is that despite three rejections at $75,000 and $1.14 billion in single-day profit-taking, Bitcoin has not collapsed. It is trading around $74,362, roughly where it was before Tuesday’s failed breakout. Something is absorbing all that selling.
Bitcoin’s climb toward the mid-$70,000s is being powered by steady institutional and macro-driven ETF inflows rather than a surge in retail speculation. US-listed spot Bitcoin ETFs have continued to draw consistent inflows this month, including roughly $240 million in a single session following geopolitical tensions in the Middle East.
The cumulative volume delta suggests demand is concentrated on specific exchanges, while activity remains weaker elsewhere. Funding rates are slightly negative, and derivatives markets show a persistent bias for put options, signalling cautious sentiment and a consolidating, not overheated, market.
Cautious and consolidating is actually a reasonable place to be. Negative funding rates mean that the people holding leveraged long positions are paying fees to stay in the trade, which is unusual. It typically signals that the market is not overheated despite the price being near multi-month highs. Overheated markets have extremely positive funding. This one does not.
The Setup Going Forward
What emerges is less a standoff than a handoff. Long-term holders appear to be distributing coins directly into ETF demand. The exchange inflows and the ETF inflows are, in effect, two sides of the same transaction, visible in different datasets. Whether that handoff clears depends on whether the new holders prove stickier than the ones exiting.
The question that matters for the next two weeks is simple: can ETF inflows and institutional buyers absorb enough of the breakeven selling to push Bitcoin decisively through $76,800? If yes, the next level of meaningful resistance sits around $85,000. If no, the $70,000 range becomes the likely destination for the next consolidation leg.
The FOMC meets on April 28 and 29, the same week as the BNB Chain hard fork, the Trump memecoin gala, and the targeted CLARITY Act Senate markup window. That is an unusually dense cluster of potential catalysts for a market that is already sitting at a level that has rejected it twice before. If any one of those events breaks decisively in Bitcoin’s favour, the breakeven sellers may finally be overwhelmed. Until then, $75,000 remains the ceiling.