
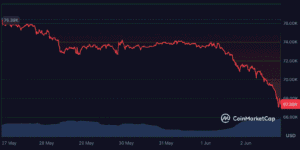
Bitcoin dropped to $68,936 on Tuesday, breaking below $69,000 for the first time since April 7. The decline from an intraday high of $72,814 erased roughly $4,000 per coin in a matter of hours. Over $766 million in leveraged crypto positions were liquidated across the market as the cascade of forced selling accelerated the move.
The trigger was geopolitical. Reports emerged Tuesday morning that Iran had suspended peace talks with the United States, reversing the fragile diplomatic progress that markets had spent weeks pricing in. The 60-day memorandum of understanding drafted just four days ago now sits unsigned. The ceasefire that was extended “indefinitely” last week is in jeopardy. And Bitcoin, already weakened by three weeks of institutional selling, had no cushion left to absorb the shock.


The price is now 45% below the October 2025 all-time high of $126,198. Strategy’s 843,706 BTC stack, purchased at an average cost basis of $75,699, is more than $6,700 per coin underwater. The Fear and Greed Index sits at 23, the lowest reading of 2026. And spot Bitcoin ETFs have now recorded 11 consecutive days of net outflows totaling approximately $3.5 billion, with BlackRock’s IBIT alone shedding $2.4 billion since May 18.
Every support level, every narrative, and every institutional safety net that was supposed to prevent this decline has failed. The market is now testing whether $65,000 to $68,000 can hold or whether a deeper correction is underway.
The Iran Catalyst That Keeps Repeating
This is the fourth time since February that the Iran conflict has crashed Bitcoin. Each time the pattern plays out the same way: peace signals emerge, the price partially recovers, military action or a diplomatic failure collapses the recovery, and Bitcoin makes a new low.
February 28: US-Israeli airstrikes hit Iranian targets. Bitcoin dropped from $80,000 to $75,000. Recovery followed the ceasefire hopes.
Mid-May: The draft memorandum of understanding was reported. Bitcoin rallied from $74,300 to $77,500 on peace optimism.
May 28: US Central Command struck an Iranian military site near the Strait of Hormuz. Bitcoin crashed from $75,700 to $72,978. Nearly $1 billion was liquidated.
June 2: Iran suspended peace talks. Bitcoin broke $70,000 and fell to $68,936. Another $766 million was liquidated.
Each cycle leaves the market weaker than the one before. The rallies for peace get smaller. The crashes on escalation get deeper. The institutional buyers who might have provided a floor during earlier sell-offs have spent three weeks withdrawing their money through ETF redemptions.
The cumulative damage is severe. Bitcoin has fallen from $82,000 in early May to $68,936 in early June, a 16% decline in 30 days. The pace and consistency of the decline, without a single meaningful multi-day bounce, suggest this isn’t a healthy correction within an uptrend. It’s a sustained trend change that hasn’t found a bottom yet.
The ETF Outflows Have Become the Market’s Defining Feature
The Iran conflict triggers the crashes. The ETF outflows sustain them. Without persistent institutional selling, Bitcoin would likely recover between geopolitical shocks, as it did earlier in the cycle. Instead, every bounce attempt gets sold because the ETF redemptions create constant downward pressure that doesn’t pause for weekends, holidays, or hope.
Eleven consecutive trading days of outflows. Approximately $3.5 billion has been pulled from spot Bitcoin ETFs since May 18. BlackRock’s IBIT accounted for $440 million on June 1 alone, and $2.4 billion over the full streak. Many participants have begun to question whether BlackRock is actively suppressing the market, given the scale and consistency of IBIT outflows.
The more likely explanation is portfolio rebalancing. Institutional investors who allocated to Bitcoin ETFs during the rally are now reducing exposure as the macro environment deteriorates. Hot inflation, elevated oil prices, stalled rate cut expectations, and a roaring AI stock market give portfolio managers compelling reasons to rotate away from crypto and into assets with stronger near-term momentum.
The problem for Bitcoin is that ETF outflows create a self-reinforcing cycle. Outflows push the price down. A falling price discourages new inflows. The absence of new inflows means the outflows have an outsized impact on price. And the falling price triggers more outflows from investors with stop-loss rules or risk management frameworks that force them to reduce positions as losses mount.
Breaking that cycle requires either a macro catalyst strong enough to reverse institutional sentiment (a rate cut, a peace deal, a dramatic improvement in inflation data) or enough time for the selling to exhaust itself. Neither has arrived.
The $766 Million Liquidation Cascade
When Bitcoin broke through $70,000 on Tuesday, the derivatives market amplified the move.
Approximately $766 million in leveraged crypto positions were liquidated across major exchanges. The vast majority were long positions, meaning traders who had been betting on a recovery were forced to close out at a loss. Each liquidation added selling pressure that pushed the price lower, triggering more liquidations and creating more selling.
This feedback loop is the same mechanism that produced nearly $1 billion in liquidations on May 28. The difference is that the starting point was lower this time. May 28 started from $75,700 and bottomed near $73,000. June 2 started from $72,814 and bottomed near $69,000. Each cascade begins from a weaker position and pushes to a lower floor.
The liquidation data also reveals how the market was positioned heading into Tuesday. Despite weeks of declining prices, a significant number of traders maintained leveraged long positions in the $69,000 to $72,000 zone, betting that the $70,000 psychological support would hold. When it didn’t, the forced unwinding of those positions accelerated the decline beyond what organic selling alone would have produced.
For the broader market, the $766 million wipeout is a reminder that leverage in crypto doesn’t just amplify gains. It creates mechanical selling pressure during declines, making every crash worse than it would otherwise be.
Strategy Is Now $5.7 Billion Underwater
The company that owns more Bitcoin than any other corporation on the planet is sitting on its largest paper loss in history.
Strategy holds 843,706 BTC at an average cost basis of $75,699. At Tuesday’s price of $68,936, the implied unrealized loss across the full position is approximately $5.7 billion. That figure has grown by over $3 billion in the past week alone as Bitcoin’s price dropped from $73,500 to $69,000.
The timing compounds the pain. Just two days ago, Strategy confirmed its first Bitcoin sale in four years, offloading 32 BTC to fund preferred stock dividends. The sale was meant to be a small, confidence-building move. Instead, it coincided with the worst week for Bitcoin in 2026 and became a symbol of a company whose defining strategy was unraveling in real time.
MSTR shares dropped below $150 on Monday and continued falling on Tuesday. The stock has now lost over 60% from its highs. For shareholders who bought MSTR as a leveraged Bitcoin play with a “never sell” commitment, the combination of the price decline, the first sale, and the mounting paper losses represents a complete reversal of the thesis they invested in.
Strategy maintains a $900 million cash reserve for dividend obligations and has $26.1 billion in remaining ATM stock issuance capacity. The company isn’t in immediate financial distress. But the gap between its cost basis and the current price is wide enough that each additional decline raises legitimate questions about whether additional sales will become necessary.
Where Bitcoin Goes From Here
The technical picture has deteriorated to its worst point of 2026.
Bitcoin has broken below a multi-month upward trading channel that supported prices since early in the year. The RSI has entered oversold territory. The Chaikin Money Flow indicator sits below the neutral line. The price is forming lower highs and lower lows across all timeframes. Every trend indicator points in the same direction: down.
Support levels below $69,000 are thin. The $65,000 to $68,000 zone represents the next major area where buying interest could emerge, based on previous consolidation patterns and on-chain supply distribution. Below that, $60,000 sits as a psychological and technical level that was last tested during the February crash.
On the upside, reclaiming $70,000 would be the minimum signal that the immediate selling pressure has eased. Above that, $72,000 and $74,000 represent the zones where sellers have been active in recent sessions. The EMA cluster at $76,400 to $76,700 is the longer-term level that needs to be recaptured to shift the trend from bearish to neutral.
Three catalysts could change the picture. The FOMC meeting on June 17-18 is the most important. If the Fed signals rate cuts despite elevated inflation, risk assets would rally sharply. The CLARITY Act’s progress through the Senate could unlock institutional demand. And a genuine resolution to the Iran conflict, not another draft or another ceasefire that collapses in days, would remove the geopolitical premium that has been compounding every selloff since February.
Until at least one of those catalysts arrives, Bitcoin trades on momentum, fear, and flow data. All three points lower.
The Contrarian Signal That Keeps Getting Louder
Long-term holder supply has reached a record 15.8 million BTC. The people who held through the $60,000 crash in February, through the $73,000 crash on May 28, and through the $69,000 crash today are still holding. Some are buying more.
That conviction in the face of relentless selling has been the single most reliable bottom indicator in Bitcoin’s history. It doesn’t tell you the exact day the decline ends. But it tells you that the strongest hands in the market believe current prices represent value to be accumulated.
The Fear and Greed Index at 23 reinforces the contrarian case. Previous readings at this level preceded recoveries from $60,000 in February, from $65,000 in early 2025, and from $16,000 in November 2022. Each time, the market felt hopeless. Each time, the recovery that followed made the despair look temporary.
None of that helps you if you’re leveraged, have a short time horizon, or need to sell in the next few weeks. The contrarian signal speaks to 6 to 12-month outcomes, not next-week price action. And in the short term, the momentum, the ETF outflows, and the geopolitical uncertainty all favor continued weakness.
Bitcoin at $68,936, with a Fear index at 23 and long-term holders in record accumulation, is either the buying opportunity of the year or the beginning of something much worse. The June 17 FOMC meeting and the Iran peace process will likely determine which one it turns out to be.
FAQ
Why did Bitcoin drop below $69,000?
Iran reportedly suspended peace talks with the United States on Tuesday, reversing the diplomatic progress that had provided markets with partial relief. The news triggered a selloff from $72,814 to $68,936, with $766 million in leveraged positions liquidated across the crypto market. The decline was compounded by 11 consecutive days of ETF outflows totaling $3.5 billion.
What are the next support levels for Bitcoin?
The $65,000 to $68,000 range is the next level where significant buying interest could emerge. Below that, $60,000 is the psychological and technical level tested during February’s crash. On the upside, Bitcoin needs to reclaim $70,000 as a first step, with the EMA cluster at $76,400 to $76,700 representing the longer-term level needed to reverse the downtrend.
How much is Strategy losing on its Bitcoin position?
Strategy holds 843,706 BTC at an average cost basis of $75,699. At the current price of $68,936, the implied unrealized loss is approximately $5.7 billion. The company confirmed its first Bitcoin sale in four years on June 1, selling 32 BTC to fund preferred stock dividends.
Disclaimer: This article is for informational purposes only and does not constitute financial advice. Cryptocurrency investments carry significant risk. Always conduct your own research before making any investment decisions.