
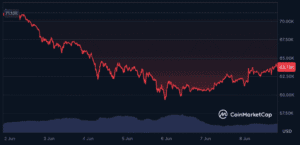
Bitcoin is holding above $63,000 on Sunday evening after rallying approximately $3,200 from Friday’s low of $59,770. The bounce arrived at the worst possible moment for bears and the best possible moment for a technical indicator that has never been wrong.
The 200-week simple moving average, the long-term trend line that smooths nearly four years of weekly closing prices into a single number, is being tested for the fourth time in eight years. The previous three tests produced rallies of 350%, 1,525%, and 688% respectively.


December 2018: Bitcoin touched the 200-week SMA at $3,100. It rallied to $14,000 within seven months.
March 2020: The COVID crash brought Bitcoin to the 200-week SMA at $4,000. It rallied to $65,000 within 13 months.
November 2022: The FTX collapse pushed Bitcoin to the 200-week SMA at $16,000. It rallied to $126,000 over the following three years.
Three tests. Three bottoms. Three multi-hundred-percent rallies. Zero failures. No other technical indicator in Bitcoin’s history has this track record. And the price is hovering right near it on a Sunday evening while the rest of the market argues about whether the bottom is in.
What Happened Over the Weekend
The bounce from $59,770 to $63,000 developed gradually rather than in a single spike.
Friday’s hot jobs report pushed Bitcoin below $60,000 for the first time since Trump’s election. The Fear and Greed Index hit 12. Over $1.7 billion in leveraged positions were liquidated. Every signal pointed to capitulation.
Then the selling stopped. Saturday’s price action was quiet, with Bitcoin consolidating between $61,500 and $62,500. On Sunday, buyers stepped in more aggressively and pushed the price above $63,000.
CoinDesk reported that Bitcoin held steady after Sunday’s rally but cautioned that a “full-fledged reversal may take longer.” The price is hovering near the 200-week moving average, a level the report described as one that “often marks major cycle turning points.”
The weekend bounce doesn’t prove the bottom is in. Weekend rallies occur on thin volume and can reverse when institutional traders return on Monday. But the location of the bounce matters more than its size. Bitcoin didn’t bounce at a random level. It bounced at the one technical level that has caught every major decline in the asset’s history.
Why the 200-Week SMA Works
The 200-week moving average isn’t magic. It works for a specific reason that’s grounded in market mechanics rather than superstition.
The moving average represents the average price that Bitcoin has traded at over the past 200 weeks, roughly 3.8 years. When the current price falls to that level, it means Bitcoin is trading at the average cost basis of everyone who bought over the past four years. Below the 200-week SMA, the majority of market participants from the past four years are underwater.
That creates a natural accumulation zone. Long-term holders who believe in Bitcoin’s multi-year thesis see prices at or below the four-year average as fundamentally undervalued. They buy. Their buying provides a floor. And because these are long-term holders by definition, they don’t sell the moment the price ticks up. They hold, reducing selling pressure and allowing the recovery to build momentum.
The indicator also functions as a self-fulfilling prophecy to some degree. Because every serious Bitcoin analyst watches the 200-week SMA, and because its track record is so widely known, buyers concentrate at that level specifically because they know other buyers will be there too. The collective expectation of support creates actual support.
That dynamic works until it doesn’t. If enough sellers overwhelm the buyers at the 200-week SMA, the level breaks and Bitcoin enters territory it has never occupied for more than a few days. Understanding both sides of that possibility is essential for anyone making decisions at this level.
The Case for the Bottom Being In
Several data points support the thesis that $59,770 was the cycle low, or very close to it.
Long-term holder supply reached a record 15.8 million BTC during the decline. The strongest-handed participants in the market are accumulating, not selling. Every previous cycle bottom coincided with long-term holder accumulation at record levels.
The Fear and Greed Index hit 12, among the lowest readings in the index’s history. Only the Terra/Luna collapse (6) and FTX implosion (10) produced lower readings. Both of those extremes preceded multi-year rallies.
Short-term holders are realising losses at the highest rate in Bitcoin’s entire history. That kind of capitulation, where recent buyers collectively throw in the towel, has historically marked the exhaustion of selling pressure.
The $1.63 billion liquidation cascade on June 4 cleared a significant amount of leverage from the system. Futures open interest dropped. Funding rates reset. The excess leverage that made the market fragile has been partially flushed.
And gold entering a bear market while Bitcoin finds support creates potential for capital rotation. If even a small percentage of the money leaving gold flows into Bitcoin, it would provide fresh demand at a level where historical support already exists.
The Case for Further Decline
The bears aren’t conceding. Their arguments carry real weight.
The 200-week SMA has never been tested during a period when the Fed was potentially raising rates rather than cutting them. Every previous touch of the moving average occurred in an environment where monetary policy was neutral or easing. In 2018, the Fed was about to pivot to cuts. In 2020, rates were at zero. In 2022, the hiking cycle was near its peak and cuts were on the horizon. In 2026, BNP Paribas is forecasting three hikes. The macro backdrop is fundamentally different from every prior test.
ETF outflows haven’t reversed. Thirteen consecutive days of selling totalling $3.58 billion removed the institutional bid that provided structural support in previous months. Until daily flows turn positive, the buying pressure that previous 200-week SMA bounces relied on isn’t available.
Strategy is $12.4 billion underwater and has already established a precedent for selling. If Bitcoin declines further, the probability of additional sales from the world’s largest corporate holder increases. Each sale, regardless of size, damages sentiment disproportionately.
And the 200-week SMA itself is lower than the current price. The moving average sits in the low-to-mid $50,000s, meaning Bitcoin would need to fall another 10% to 15% from current levels to test it directly. The bounce at $59,770 happened above the actual moving average. A true test would occur near $55,000, which means the market may not have found the real floor yet.
The Week Ahead Is Loaded
The next seven days carry more catalysts per square inch than any week in 2026.
US CPI data drops this week. If inflation comes in soft, it revives rate cut hopes and risk assets rally. If it comes in hot, it reinforces the rate hike narrative and Bitcoin faces another leg lower.
The European Central Bank delivers its rate decision. Any surprise easing from the ECB would improve global risk appetite.
SpaceX begins trading on June 12 at a $1.75 trillion valuation. The company holds 18,712 BTC. A successful listing could reignite interest in the crypto-adjacent economy.
And the FOMC meeting on June 17-18 looms. Warsh’s first rate decision is the single most important event for crypto in the second half of the year.
Each catalyst independently can move Bitcoin 5% to 10%. If CPI comes in soft, the ECB eases, SpaceX lists successfully, and Warsh signals flexibility on rates, the recovery from $63,000 toward $70,000 to $75,000 becomes the base case. If CPI is hot, the ECB holds, and Warsh is hawkish, the 200-week SMA gets its direct test near $55,000.
What to Do With This Information
The 200-week SMA is a signal, not an instruction. It tells you where Bitcoin has historically found a floor. It doesn’t tell you to buy right now with everything you have.
For long-term investors with 12 to 24 month horizons, every previous test of the 200-week SMA produced a rally that made the entry look brilliant in hindsight. The current test is occurring with fundamentals that are different from previous instances, but the investor profile that benefits from buying near this level hasn’t changed: patient, low-leverage, comfortable absorbing further short-term declines.
For traders with shorter horizons, the weekend bounce needs Monday confirmation. If Bitcoin holds $63,000 on Monday with rising volume and ETF flows stabilise, the bounce has legs. If it fades back below $61,000 on thin volume, it was a weekend fake-out and the downtrend resumes.
For everyone, the honest assessment is this: Bitcoin is near the most significant technical level in its history. That level has never failed. The macro environment is the most challenging it has faced at any previous test. Whether the historical pattern holds or breaks will be determined by the catalysts arriving over the next 10 days.
The 200-week SMA is being tested. The market is about to find out if the line holds for a fourth time.
FAQ
What is the 200-week moving average and why does it matter?
The 200-week SMA is the average Bitcoin price over the past 200 weeks (approximately 3.8 years). It has marked the exact bottom of every major Bitcoin bear market: $3,100 in December 2018, $4,000 in March 2020, and $16,000 in November 2022. Bitcoin has never sustained a decline below this level. It currently sits in the low-to-mid $50,000s.
Is the bottom confirmed at $59,770?
Not yet. The weekend bounce to $63,000 is encouraging but occurred on thin weekend volume. Confirmation requires Bitcoin holding above $63,000 on Monday, ETF flows stabilising, and positive macro catalysts from CPI data and the June 17-18 FOMC meeting. The actual 200-week SMA sits lower in the $55,000 range, meaning a true test of the moving average hasn’t occurred yet.
What could cause the 200-week SMA to fail for the first time?
The macro environment is the key risk. Every previous test occurred with monetary policy neutral or easing. The current test is happening with rate hikes being discussed and a stronger dollar. If the Fed hikes rates, ETF outflows continue, and no geopolitical resolution materialises, the selling pressure could overwhelm the historical buying pattern at the 200-week SMA for the first time.
Disclaimer: This article is for informational purposes only and does not constitute financial advice. Cryptocurrency investments carry significant risk. Always conduct your own research before making any investment decisions.