


BNB reversed from pivotal resistance at $720 on 31 August, ending an August run that had lifted the token roughly 16% in a week and pushed its daily Relative Strength Index to 85.25, deep into overbought territory.
The rejection came at a level with history. That $720 zone stopped the previous intermediate correction at the end of May, and it sits inside a combined resistance area alongside the 50% Fibonacci retracement of the prior decline. Analysts at the time flagged $650 as the likely destination on a failed test.


Note on data: the levels below are drawn from analysis published between late August and 31 August. Traders should confirm current spot pricing before acting on any of them.
The setup arrives as the broader market weakens. Bitcoin has fallen below $77,000 on renewed US strikes on Iran, with markets pricing roughly a 66% chance the Federal Reserve raises rates on 16 September.
The August run was steep and narrow
BNB spent the first half of August trapped in a $600 to $620 range before buyers pushed it through $650.
The move accelerated from there. The token gained about 16% over seven days, reached a weekly high near $725, and lifted its market capitalisation to approximately $93 billion, holding fourth place among crypto assets. Circulating supply stood at roughly 133.16 million BNB.
The problem with a move that fast is what it does to momentum readings. BNB’s daily RSI reached 85.25, with its own moving average trailing at 69.85. That divergence between the reading and its average is a signature of a vertical move rather than a sustainable trend.
An overbought RSI does not guarantee reversal. It does raise the probability of consolidation or a sharper pullback once buying slows, which is what the $720 rejection delivered.
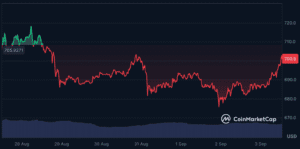
The levels that define the structure
Four numbers matter, and they are unusually well defined for a token that spent much of 2026 range-bound.
On the upside, $745 is the level analyst EinsteinBTC1 identified as the larger breakout on the weekly chart. A weekly close above it would open a path toward $960, with the former all-time-high region near $1,376 framed as a longer-term target. Before reaching it, BNB has to clear the $719 to $734 resistance band, where liquidation clusters at $710 and $719 could pull price higher if momentum returns.
On the downside, $687.50 is the line that preserves the immediate bullish setup. Below that, $663 was the 4-hour Supertrend’s dynamic support and functions as the level at which the rally can reasonably be described as losing strength. Below $663, the $650 zone identified in the 31 August wave analysis becomes the target.
The wider structural context matters too. Analysis from earlier in August noted BNB had reclaimed its 200-week moving average while remaining well below its 200-day average around $665, describing a market with subdued volatility and no strong directional conviction from speculative positioning. The daily ADX read 18.47, confirming a non-trending environment despite the momentum readings.
That combination, strong short-term momentum inside a structurally undecided market, is what makes the $663 to $687.50 band the deciding range rather than any single number.
Macro is now the dominant input
Whatever the chart shows, BNB is unlikely to resolve independently of the broader market this month.
Renewed US airstrikes on Iranian targets near the Strait of Hormuz have pushed Brent crude past $93 and lifted the 10-year Treasury yield toward 4.8%. Bitcoin has fallen below $77,000, ether below $2,400, and total crypto market capitalisation has slipped to around $2.7 trillion.
Federal Reserve Chair Kevin Warsh used his Jackson Hole keynote on 28 August to warn that inflation was not yet beaten. Markets now price roughly a 66% chance of a rate increase on 16 September, up sharply from where they sat a month ago.
Higher yields raise the opportunity cost of holding any non-yielding asset. For BNB specifically, that pressure compounds an already overbought technical position.
There is also a documented correlation to watch directly. One analysis noted that pressure may form on BNB if bitcoin dominance increases, particularly if bitcoin falls below $78,641 while BNB tests resistance. Bitcoin has since done exactly that.
August employment data arrives Friday and is the nearest scheduled catalyst before the Fed decision.
The ETF question is still unanswered
VanEck launched VBNB, the first US spot BNB exchange-traded product, on 28 May. Each share is backed by BNB held in cold storage, with staking planned for incorporation into the structure.
The launch itself produced a short squeeze that carried BNB above $700 at the time. What it has not yet produced is sustained flow data.
Assets under management closed the launch week at roughly $1 million. For comparison, Solana ETFs have accumulated around $1.22 billion in cumulative net inflows and XRP funds approximately $1.68 billion. BNB is the fourth-largest crypto asset by market capitalisation, which is the basis on which some analysts have argued it should eventually attract comparable interest.
Whether it has done so is not currently verifiable from public reporting, and that gap matters. An ETF that exists is different from an ETF that is absorbing supply. Consistent inflow data would be the single strongest confirmation available for the bullish case; its absence leaves the technical structure carrying the argument alone.
What to watch
The immediate test is whether $687.50 holds. It preserves the setup that carried BNB from $600 to $725.
Below it, $663 is where the rally stops looking like a pullback and starts looking like a failed breakout, with $650 the level flagged as the likely landing zone after the $720 rejection.
Above, nothing changes structurally until BNB clears $734 and closes a week above $745. Until then the token is trading inside a defined resistance band with an overbought momentum reading behind it and a hawkish Fed in front of it.
BNB Chain ecosystem activity, including memecoin volume and DEX throughput, has supported the token independently of broader market direction at points this year. Whether that holds through a genuine risk-off stretch is the question September will answer.
FAQ
Where did BNB reverse?
BNB reversed from pivotal resistance at $720 on 31 August, a level that also stopped the previous intermediate correction at the end of May and sits within a combined resistance area including the 50% Fibonacci retracement. Analysts flagged $650 as the likely support target on a failed test.
Why does the RSI reading matter?
BNB’s daily RSI reached 85.25 during the run to $725, well above the conventional overbought threshold of 70, with its moving average trailing at 69.85. That gap indicates momentum built very quickly. An overbought reading does not guarantee reversal but raises the risk of consolidation or a sharper pullback if buying slows.
What are the key levels?
Upside: $719 to $734 resistance band, then $745 as the weekly breakout level, which analyst EinsteinBTC1 said would open a path toward $960. Downside: $687.50 preserves the bullish setup, $663 marks the point at which the rally is losing strength, and $650 is the target flagged after the $720 rejection.
Disclaimer: This article is for informational purposes only and does not constitute financial advice. Cryptocurrency investments carry significant risk. Always conduct your own research before making any investment decisions.