


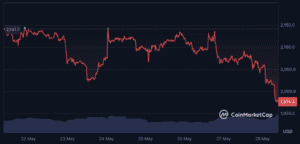
The level every Ethereum holder was watching just gave way. ETH crashed below $2,000 on Wednesday morning after US airstrikes on an Iranian military site near the Strait of Hormuz sent risk assets into freefall across the board.
Ethereum is trading near $1,960, down roughly 60% from its all-time high of $4,953 set in August 2025. The $2,000 psychological floor that held through three separate tests over the past three weeks has now failed on the fourth. Bitcoin dropped below $73,000 in the same move. Nearly $1 billion in leveraged crypto positions were liquidated in 24 hours, with 93% of those being long positions. It’s the biggest single-day wipeout of 2026.


This wasn’t a slow grind lower. This was a trapdoor opening beneath the market’s feet. The ceasefire that was extended “indefinitely” just days ago is now in ruins. And Ethereum, already weakened by six straight losing weeks and relentless ETF outflows, took the worst of the damage.
What Triggered the Crash
US military forces struck an Iranian military installation near the Strait of Hormuz early Wednesday, destroying the ceasefire that markets had been pricing in for two weeks. The strikes reignited fears of a broader Middle East conflict, sent oil prices surging, and triggered an immediate selloff across every risk asset class.
Crypto was hit the hardest. Bitcoin dropped from $75,700 to below $73,000. Ethereum fell from $2,075 to below $2,000. Altcoins including ONDO, Render, Worldcoin, Virtuals Protocol, and Celestia posted losses of 5% to 12%. The total crypto market cap shed tens of billions in hours.
The liquidation cascade amplified everything. When Bitcoin broke $74,000, leveraged long positions across major exchanges started getting automatically closed. That forced selling pushed prices lower, which triggered more liquidations, which created more selling. The feedback loop produced nearly $1 billion in total liquidations, with Bitcoin and Ethereum accounting for the majority.
For Ethereum specifically, the damage was compounded by the fact that ETH was already sitting just above its last line of support. The $2,000 level didn’t have much cushion left. When the geopolitical shock hit, there wasn’t enough buy-side liquidity to absorb the selling.
Eleven Straight Days of ETF Outflows
The airstrikes were the trigger. But Ethereum’s vulnerability to this kind of shock has been building for weeks.
Spot Ethereum ETFs have now posted eleven consecutive days of outflows, bringing the monthly total to approximately $401 million. That’s the longest losing streak for ETH ETFs since their launch. Every single day in May has seen more money leave than enter.
The contrast with Ethereum’s early ETF days is painful. When spot ETH ETFs first launched, there was genuine optimism that institutional demand would provide a structural bid similar to that delivered by Bitcoin ETFs. That optimism has evaporated. JPMorgan analysts recently said ETH ETF demand has been “weaker than many investors expected,” pointing to limited staking integration, softer institutional participation, and rising competition from Bitcoin funds.
The numbers tell the story. Bitcoin ETFs have attracted over $56 billion in cumulative inflows since launch. Ethereum ETFs haven’t come close to replicating that demand. And the gap keeps widening. When institutional investors allocate to crypto, they overwhelmingly choose Bitcoin. When they reduce their crypto exposure, Ethereum gets cut first.
Eleven straight days of outflows mean there is no institutional bid under this market right now. Every bounce attempt over the past two weeks has been sold. The people managing the world’s largest pools of capital are actively reducing their exposure to Ethereum, and today’s crash confirms they were right to do so.
The Whales Are Gone Too
It’s not just ETF investors leaving. The biggest on-chain holders have been quietly exiting for months.
Approximately 60 Ethereum whale addresses holding at least 10,000 ETH have exited or consolidated their positions over the past two months. That’s 60 wallets, each holding at least $20 million in ETH, that have either sold entirely or significantly reduced their positions.
Harvard’s endowment dumped its entire $87 million ETH allocation. Garrett Jin deposited $1.35 billion in ETH to Binance. Goldman Sachs cut its ETH exposure. BlackRock and Fidelity moved a combined $80 million in ETH to exchanges.
The combined effect of ETF outflows, whale exits, and institutional selling created a market in which the only significant buying came from long-term holders and retail investors. That demand wasn’t strong enough to defend $2,000 when a genuine geopolitical shock arrived.
The irony is that while holders were selling, BlackRock was simultaneously filing to put its $7 billion money-market fund on Ethereum. The network’s institutional relevance as infrastructure is growing. Its institutional appeal as an investment is shrinking. That contradiction defines Ethereum in 2026.
Where ETH Goes From Here
With $2,000 broken, the technical roadmap shifts dramatically.
The immediate support sits at $1,900, the level where ETH found a floor during the February-March selloff earlier this year. If $1,900 holds, the market enters a consolidation phase between $1,900 and $2,000 as it digests the shock. A bounce back above $2,000 within the next few days would suggest the breakdown was a panic-driven wick rather than a structural shift.
If $1,900 fails, the next major support is $1,750-$1,650. Polymarket puts 73% odds on ETH dropping to $1,750 before the end of 2026. That prediction felt aggressive a week ago. With ETH already below $2,000, it looks increasingly plausible.
Below $1,650, there isn’t much technical support until the $1,400-$1,500 region, where ETH last traded in late 2023. A decline to those levels would represent a roughly 70% drawdown from the all-time high and would test the conviction of even the most committed Ethereum believers.
On the upside, reclaiming $2,000 is the first thing bulls need to see. It was supported for three weeks. Now it becomes resistance. Pushing back above it and holding for multiple daily closes would be the minimum signal that the breakdown was temporary. Above $2,000, the next targets are $2,100, $2,211 (the 50-day EMA), and $2,300. But all of that is irrelevant until $2,000 is recaptured.
Six Losing Weeks and Counting
Context matters. Today’s crash didn’t happen in isolation. It’s the latest chapter in a losing streak that has been building since mid-April.
Ethereum has now posted six consecutive losing weeks. In that stretch, ETH has fallen from $2,450 to below $2,000, a decline of roughly 18%. Each week has produced a lower high and a lower low. Every bounce has been sold. Every support level has eventually failed.
The underperformance against Bitcoin has been even more severe. While BTC has lost three of those six weeks, ETH has lost all six. The ETH/BTC ratio is at its lowest level since 2021. Bitcoin dominance dropped from 60% to 58% this month, but that rotation hasn’t benefited Ethereum. The money flowing out of Bitcoin is going into HYPE, ONDO, privacy coins, and AI tokens. Not into ETH.
The structural problems driving this underperformance haven’t changed. Competition from Solana and Layer 2s continues to siphon activity. ETF flows are persistently negative. The brain drain from the Ethereum Foundation accelerated with eight senior researchers leaving in 2026. And the Glamsterdam upgrade, while technically live since May 1, hasn’t produced the demand response that bulls expected.
Today’s Iran-driven crash didn’t create Ethereum’s problems. It exposed them. A healthy market with strong underlying demand can absorb a geopolitical shock. ETH couldn’t because the demand wasn’t there to begin with.
The Fundamental Case Hasn’t Died. The Price Has Ignored It
This is the hardest part for Ethereum believers. The fundamental case for the network has arguably never been stronger. And the price is at its lowest level in three months.
BlackRock is building tokenized fund products on Ethereum. The network has 189.5 million wallet holders. Over 66% of the supply is locked in staking. The Glamsterdam upgrade tripled the gas limit. Jane Street added $82 million in ETH ETFs. Tokenized assets on Ethereum exceed $8 billion. The network still hosts more DeFi value than all other blockchains combined.
None of that mattered today. When bombs fall, fundamentals take a back seat to fear. And when the Fear and Greed Index has been stuck at “Extreme Fear” for three consecutive weeks, the market is telling you that the people with money are scared and selling, regardless of what the on-chain data says.
The question every ETH holder needs to answer is whether today’s break below $2,000 is a capitulation event that marks the bottom, or the start of a deeper decline that could take ETH toward $1,750 or lower.
History offers a clue. The last time ETH touched $1,837 was February 28, 2026. It bounced sharply from that level and rallied to $2,450 by mid-April. If a similar pattern plays out, the current crash could be a buying opportunity for anyone with the conviction and risk tolerance to act while everyone else is panicking.
But history also shows that when major support levels break during geopolitical crises, the recoveries take longer and go deeper than anyone expects. The Iran situation is fluid. The airstrikes could escalate into a broader conflict. Oil could spike further. And the Fed, already dealing with hot inflation, has even less room to cut rates.
The honest answer is: nobody knows. The $2,000 floor just broke. What comes next depends on whether bombs stop falling, institutions stop selling, and the market finds a reason to believe again.
FAQ
Why did Ethereum crash below $2,000?
US airstrikes on an Iranian military site near the Strait of Hormuz early Wednesday triggered a market-wide selloff. Nearly $1 billion in leveraged crypto positions were liquidated in 24 hours, with 93% of the positions being longs. Ethereum, already weakened by eleven consecutive days of ETF outflows and six straight losing weeks, broke through its $2,000 support on the fourth major test.
Where is Ethereum’s next support?
Immediate support sits at $1,900, where ETH found a floor during the February-March selloff. If $1,900 fails, the next major zone is $1,750-$1,650. Polymarket assigns 73% odds to ETH reaching $1,750 before year-end. Below $1,650, technical support is limited until the $1,400 to $1,500 range.
Should I sell my Ethereum?
ETH is now down 60% from its all-time high at a time when geopolitical uncertainty is elevated and institutional outflows are persistent. However, the network’s fundamentals remain strong: 189.5 million wallet holders, BlackRock building on Ethereum, 66% of supply staked, and the Glamsterdam upgrade live. Previous crashes to similar levels have preceded sharp recoveries. Any decision should be based on your own risk tolerance, time horizon, and ability to withstand further downside.
Disclaimer: This article is for informational purposes only and does not constitute financial advice. Cryptocurrency investments carry significant risk. Always conduct your own research before making any investment decisions.