
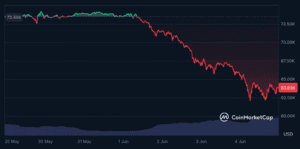
Bitcoin opened Tuesday at $66,739. It briefly pushed to $67,477. Then the floor disappeared.
By early Wednesday morning, BTC had crashed to $61,000, a $6,000 decline in less than 12 hours. Over $1.63 billion in leveraged crypto positions were liquidated across the market, with $1.38 billion of that coming from long trades. Bitcoin alone accounted for $740 million in liquidations. Ethereum added another $382 million. Solana contributed $85 million.


It’s the largest single-day wipeout of 2026. The previous record, $1 billion on May 28 during the Iran airstrikes, was demolished by 63%. More than $700 million was liquidated in just four hours during the fastest phase of the crash, a pace of destruction that rivals the worst moments of the 2022 bear market.
Bitcoin is now 51% below the $126,198 all-time high set eight months ago. Total crypto market capitalisation dropped to $2.18 trillion, approaching the February 2026 lows. The Fear and Greed Index hit 12, the lowest reading of the entire year and among the lowest in Bitcoin’s history.
The market didn’t just crack. It collapsed.
The Leverage Tower That Was Waiting to Fall
The crash was caused by the conditions, not the trigger. Understanding why explains how $6,000 can vanish from Bitcoin’s price while most of the world sleeps.
Before the drop, Bitcoin’s futures open interest leverage ratio had climbed to 2.63%. The perpetual futures version reached 2.48%. Both were the highest readings since October 6, 2025, the date that preceded the “Black Friday” crash, one of the most violent liquidation events of the previous cycle.
When leverage gets that stretched, the market becomes fragile in a specific way. Thousands of leveraged long positions sit stacked at similar price levels, each with a liquidation point not far below the current price. The market doesn’t need a catastrophe to crash. It needs a nudge big enough to hit the first cluster of those liquidation points. After that, the dominoes fall on their own.
The nudge was almost comically small. Strategy’s disclosure of selling 32 BTC for $2.5 million, announced on June 1, continued reverberating through market sentiment. Combined with the 12th consecutive day of ETF outflows and Bitcoin’s failure to reclaim $68,000 on Tuesday, enough sellers emerged to push the price into the first liquidation cluster near $65,000.
From there, the cascade was mechanical. Long positions at $65,000 were liquidated, forcing selling that pushed the price to $63,000. Positions at $63,000 were liquidated, forcing selling that pushed the price to $61,000. Each level fell into the next. The $700 million liquidated in four hours was almost entirely automatic, algorithms closing positions into a market with no buyers willing to catch the knife.
The Numbers That Define This Crash
The damage across the broader market tells the story of a selloff that spared nothing.
Daily trading volume exploded past $393 billion, more than double the previous day’s $143 billion. The spike reflects panic selling, forced liquidations, and opportunistic traders trying to profit from the volatility. When volume doubles overnight, it means the market moved from orderly decline to disorderly collapse.
Spot Bitcoin ETFs added to the pressure with a further $396 million in outflows on Tuesday, extending the streak to 12 consecutive days with cumulative withdrawals of approximately $3.58 billion. That’s less than Monday’s $500 million exodus but still deeply negative. Not a single day in the past two and a half weeks has posted positive ETF flows.
Strategy’s 843,706 BTC stack, purchased at an average of $75,699 per coin, is now approximately $12.4 billion underwater at current prices. The company that built its identity around Bitcoin conviction has watched its position swing from $5.7 billion in unrealised losses two days ago to $12.4 billion today. MSTR shares are down over 60% from their highs.
Whales holding between 10 and 10,000 BTC sold nearly 25,000 BTC in just the past week. That’s roughly $1.5 billion in Bitcoin dumped by large holders during the same period that ETFs were bleeding and retail was getting liquidated. The selling pressure came from every direction simultaneously.
Why the Crash Happened at 3 AM
The timing wasn’t random. The deepest part of the crash occurred during Asian trading hours when US and European markets were closed and liquidity was at its thinnest.
Thin liquidity means fewer buy orders sitting on exchange order books. In a normal market with healthy depth, a wave of selling gets absorbed by buyers at progressively lower prices. In a thin overnight market, the same wave of selling falls through gaps in the order book, producing much larger price moves than the selling volume alone would suggest.
Liquidation cascades during low-liquidity hours are particularly brutal because the forced selling hits a market with fewer participants to absorb it. The $700 million liquidated in four hours would have produced a smaller price impact during US trading hours when order book depth is three to five times greater.
This pattern has repeated at every major crash in the current cycle. The worst of the February collapse happened overnight. The May 28 Iran-driven crash deepened during Asian hours. Leveraged positions don’t respect time zones, but liquidity does. The mismatch creates conditions where crashes that start as 3% declines during active hours turn into 10% collapses overnight.
$60,000 Is Now the Line Between Correction and Crisis
Bitcoin touched $61,000 and bounced slightly. The $60,000 psychological level, which was last tested during the February crash, is now the most important number in crypto.
Above $60,000, the current decline qualifies as a severe but historically normal correction. A 51% drawdown from the all-time high is painful but within the range of previous cycle pullbacks. Bitcoin dropped 77% in 2022, 84% in 2018, and 86% in 2014. A 51% decline, while devastating for anyone who bought near the top, doesn’t break the long-term structural thesis.
Below $60,000, the narrative shifts. A breakdown through the February low would mean Bitcoin is making new lows for the first time since the cycle began. It would invalidate the higher-low pattern that has defined the 2024-2026 bull market structure. And it would raise legitimate questions about whether the post-halving cycle peaked at $126,000 in October 2025 and is now in a full bear market.
Analyst Benjamin Cowen has placed probability on a new cycle low in 2026, with October as his base case for the trough. If Bitcoin breaks $60,000, Cowen’s thesis gains significant credibility and the next major support doesn’t appear until the $55,000 to $57,000 zone.
The difference between $61,000 and $59,000 is $2,000 in price and potentially the difference between “bad correction” and “bear market confirmed.”
The Fear Index at 12: What History Says
The Fear and Greed Index dropped to 12 on Wednesday, its lowest reading of 2026 and among the lowest in the index’s history. For context, the index hit 6 during the Terra/Luna collapse in May 2022 and 10 during the FTX implosion in November 2022.
A reading of 12 puts the current moment in the same emotional category as the two worst crises in recent crypto history. Whether that comparison is justified by the fundamentals or driven by overleveraged traders getting wiped out is a question the market will answer over the coming weeks.
Historically, extreme Fear readings have been among the most reliable contrarian buy signals in crypto. The February 2026 crash produced a Fear reading of 15 and was followed by a rally from $60,000 to $82,000. The November 2022 reading of 10 preceded a rally from $16,000 to $126,000 over the following three years.
The pattern is clear but the timing is not. Extreme Fear tells you the market is near a zone where long-term buying tends to produce strong returns. It doesn’t tell you whether the bottom is today, next week, or two months from now. The February 2026 example produced a recovery within days. The November 2022 example took months before the rally began in earnest.
For long-term investors, a Fear reading of 12 is the kind of environment where patient buying has historically been rewarded. For traders, it’s the kind of environment where trying to catch the bottom too early produces devastating losses if the decline extends further.
What Comes Next
Three catalysts determine whether $61,000 holds or breaks.
The FOMC meeting on June 17-18 remains the single most important event. If Warsh signals rate cuts, risk assets rally and the selling pressure eases. Positive geopolitical developments helped: Israel and Lebanon reached a ceasefire Thursday, and Trump signalled potential progress on US-Iran talks this weekend. Oil dropped 4% to $92 on the news, which eases inflation pressure and gives the Fed more room.
ETF flows need to reverse. Twelve consecutive days of outflows totalling $3.58 billion have been the mechanical engine driving this decline. Until that engine stops, bounces get sold.
And leverage needs to wash out completely. Funding rates need to reset. Open interest needs to decline to levels where the market isn’t a tower of margin waiting to topple. The $1.63 billion in liquidations on Wednesday cleared a significant amount of leverage, but the process may not be complete.
Bitcoin at $61,000 with a Fear index at 12 and $1.63 billion in freshly liquidated leverage. Either the bottom is very close or $60,000 is about to break. The next two weeks will tell.
FAQ
How much was liquidated in the crash?
Approximately $1.63 billion in leveraged crypto positions were liquidated in 24 hours, with $1.38 billion from long trades. Bitcoin accounted for $740 million, Ethereum for $382 million, and Solana for $85 million. Over $700 million was liquidated in just four hours during the fastest phase of the crash.
Why did Bitcoin crash from $67,000 to $61,000?
The market was primed for a crash due to extreme leverage. Futures open interest leverage ratios reached levels last seen before the October 2025 Black Friday crash. Strategy’s 32 BTC sale, 12 consecutive days of ETF outflows ($3.58B total), and whale selling of 25,000 BTC in one week created enough pressure to trigger the first cluster of liquidations. The cascade did the rest.
Is $60,000 the bottom?
The $60,000 level is the last major support before the February 2026 lows. A hold above $60,000 keeps the current decline within normal cycle correction territory. A breakdown below it would signal that Bitcoin may be entering a full bear market, with the next support at $55,000 to $57,000. The Fear and Greed Index at 12 is historically a contrarian buy signal, but timing the exact bottom remains impossible.
Disclaimer: This article is for informational purposes only and does not constitute financial advice. Cryptocurrency investments carry significant risk. Always conduct your own research before making any investment decisions.