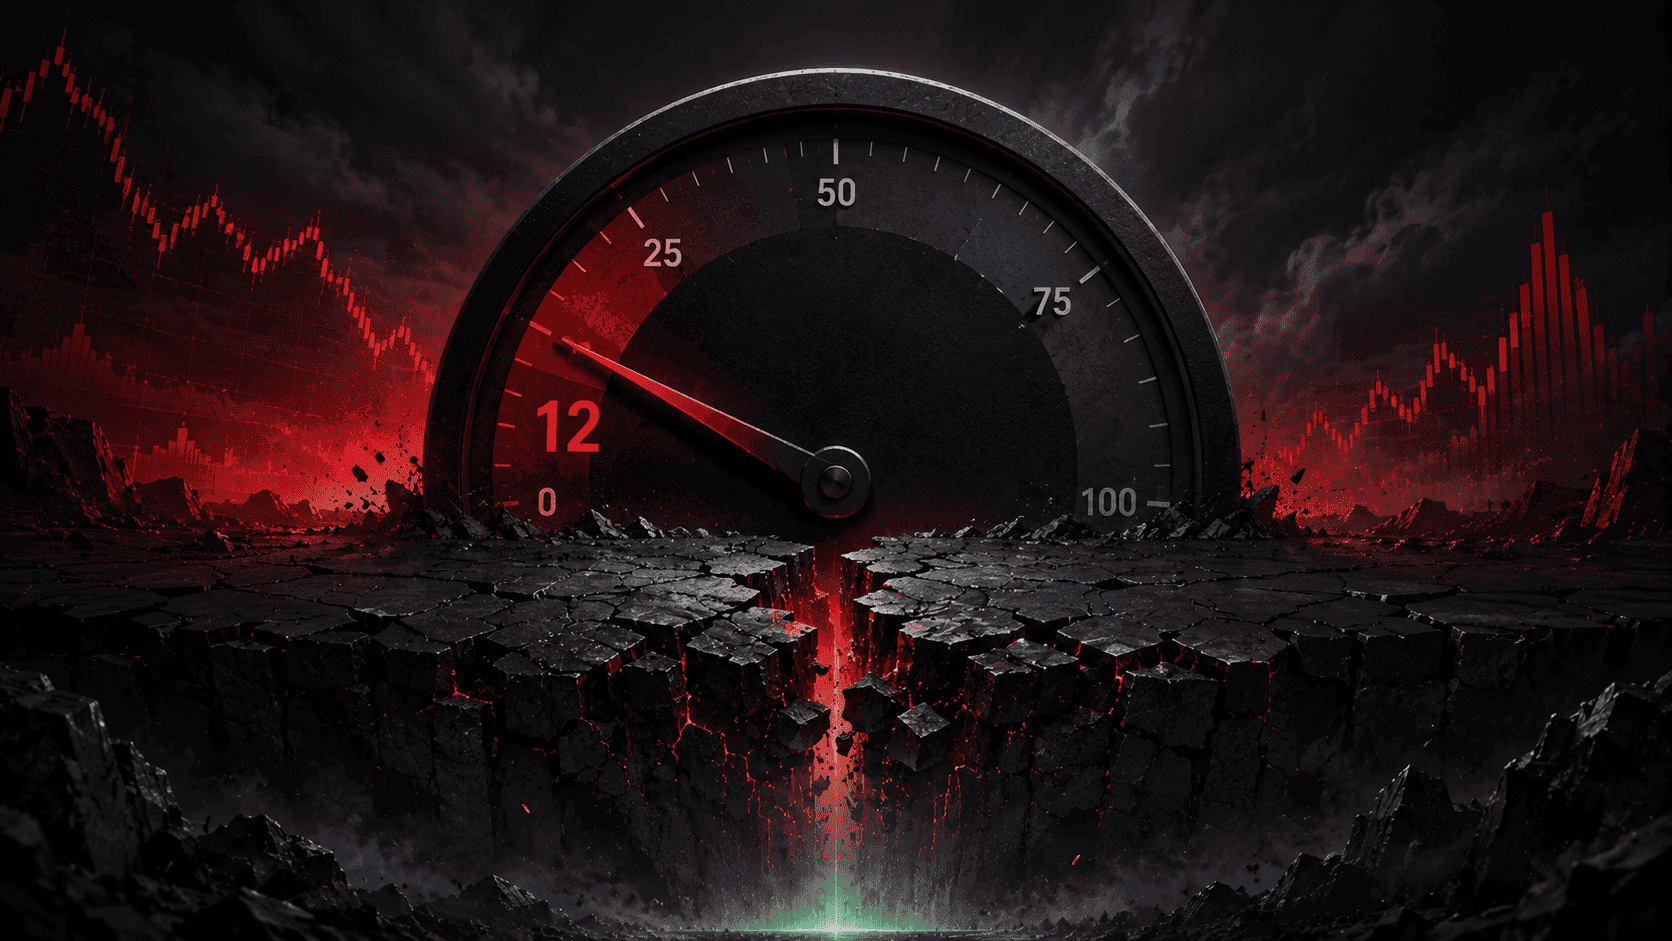
The number is 12. That’s where the Crypto Fear and Greed Index sits on Wednesday morning after Bitcoin crashed to $61,000, $1.63 billion in leveraged positions were wiped out, and the total crypto market capitalisation dropped to $2.18 trillion.
For context, the index hit 6 during the Terra/Luna collapse in May 2022. It hit 10 during the FTX implosion in November 2022. A reading of 12 puts the current moment in the same emotional neighbourhood as the two worst crises in recent crypto history.


Total market capitalisation at $2.18 trillion is approaching the February 2026 low, when Bitcoin touched $60,000 and the market briefly dipped below $2.1 trillion before recovering. That level held for one day before a sharp bounce began. Whether it holds again is the question that every investor in crypto is asking right now.
The numbers are extreme. The fear is extreme. And if history is any guide, the opportunity might be too. The hard part is figuring out which extreme matters more.
What the Fear Index Actually Measures
The Fear and Greed Index isn’t a gut feeling translated into a number. It’s a composite metric that aggregates multiple data sources including volatility (how fast and far prices are moving), market momentum (current price versus recent averages), social media sentiment (what people are saying), Bitcoin dominance (whether capital is fleeing to BTC or spreading across altcoins), and trading volume relative to recent averages.
A reading of 12 means every single one of these components is flashing extreme negativity simultaneously. Volatility is elevated. Momentum is deeply negative. Social media is flooded with panic. Bitcoin dominance is rising as capital flees altcoins for the relative safety of BTC. And volume has spiked to more than double its recent average as forced liquidations and panic selling overwhelm normal trading activity.
The index ranges from 0 (absolute maximum fear) to 100 (absolute maximum greed). Readings below 25 are classified as “Extreme Fear.” Readings below 15 have occurred fewer than a dozen times in the index’s history. Each previous occurrence coincided with a significant market event that either marked a bottom or came within weeks of one.
That track record is what makes a reading of 12 worth paying attention to, even though the emotional instinct is to run from the market rather than toward it.
Every Previous Reading This Low Led to a Recovery
This is the data point that contrarian investors are focused on. It doesn’t guarantee anything about tomorrow or next week. But the historical pattern is remarkably consistent.
November 2022, Fear index at 10. Bitcoin was trading at approximately $16,000 following the FTX collapse. Over the following 35 months, BTC rallied to $126,000, a gain of nearly 700%.
May 2022, Fear index at 6. Bitcoin was at $27,000 after the Terra/Luna implosion. The price continued falling to $16,000 over the following six months before the recovery began. The index correctly signalled extreme fear, but the bottom wasn’t reached for another five months.
February 2026, Fear index at 15. Bitcoin was at $60,000 after the initial Iran-driven selloff. The price bounced within days and rallied to $82,000 over the following two months.
The pattern has two consistent features. First, every reading below 15 occurred near a significant price level that either became the bottom or came very close to it. Second, the timing between the extreme reading and the actual bottom varied from days to months.
That inconsistency in timing is what makes extreme Fear readings useful for long-term investors but dangerous for short-term traders. If you’re buying to hold for 12 to 24 months, a reading of 12 has historically been an excellent entry signal. If you’re trying to time the exact bottom for a leveraged trade, the index can be at 12 while the price still has another 20% to fall.
The $2.18 Trillion Line in the Sand
Total crypto market capitalisation at $2.18 trillion is the macro-level equivalent of Bitcoin’s $60,000 to $61,000 support zone. It’s the level where the entire market found a floor in February and bounced.
The market cap figure captures the combined value of every cryptocurrency in existence. When it falls to levels last seen during a crisis that was followed by a recovery, it tells you that the current selloff has erased months of gains across the board, not just in Bitcoin.
In February, the $2.1 trillion floor held because three things happened in quick succession: Iran ceasefire talks produced initial optimism, Bitcoin ETF outflows slowed, and the RSI on multiple assets hit oversold levels that attracted technical buyers. The bounce was sharp, pushing total market cap back above $2.5 trillion within weeks.
For the $2.18 trillion level to hold again, similar conditions need to emerge. The Israel-Lebanon ceasefire announced Thursday is a positive geopolitical signal. Trump’s comments about progress on Iran talks this weekend could provide another. Oil dropping 4% to $92 eases inflation pressure. And the sheer scale of the liquidation, $1.63 billion in a single day, may have cleared enough leverage to allow the market to stabilise.
If $2.18 trillion breaks and total market cap falls below $2.1 trillion, the February floor is gone. The next significant level would be approximately $1.9 trillion, which the market last visited in late 2024. That would represent a further 13% decline from current levels and would take the total crypto market to its lowest value in nearly two years.
What’s Different This Time
The bullish comparison to previous extreme readings comes with important caveats about what’s changed since February.
ETF outflows are worse. February saw a few days of negative flows before inflows resumed. June has seen 12 consecutive days of outflows totalling $3.58 billion with no sign of reversal. The institutional bid that provided a floor in February isn’t there right now.
The leverage situation is worse. Futures open interest leverage ratios before Wednesday’s crash were at levels last seen before the October 2025 Black Friday event. The $1.63 billion liquidation cleared some of that leverage, but funding rates haven’t fully reset and new leveraged positions are already being built.
Corporate conviction is worse. In February, Strategy was still buying. Today, Strategy has sold Bitcoin for the first time, sits $12.4 billion underwater, and its CEO is explaining why selling is now part of the toolkit. Sequans Communications is liquidating its entire stack. The corporate treasury narrative that provided psychological support has cracked.
The Fear index at 12 signals that selling may be approaching exhaustion. But the structural conditions that caused the selloff, ETF outflows, leverage washout, corporate capitulation, haven’t fully resolved. That creates a scenario where the extreme reading is correct about being near a zone of value but potentially premature about the bottom being in.
The Two Scenarios From Here
The market resolves in one of two ways over the coming weeks.
In the recovery scenario, the $60,000 to $61,000 zone holds. ETF outflows slow and eventually reverse. The FOMC meeting on June 17-18 produces dovish signals from Warsh. The Iran situation de-escalates following Trump’s weekend comments. Leverage resets to healthy levels. And the market bounces sharply from extreme oversold conditions, similar to the February pattern, pushing Bitcoin back toward $70,000 to $75,000 and total market cap above $2.4 trillion.
In the breakdown scenario, $60,000 fails. ETF outflows continue accelerating. Warsh signals rates staying higher for longer. The Iran peace process collapses again. Whale selling continues. And the market drops through February’s lows, entering territory that could take Bitcoin to $55,000 and total market cap below $2 trillion. Benjamin Cowen’s October 2026 cycle bottom thesis becomes the base case.
The recovery scenario has history on its side. Every Fear reading below 15 has eventually been followed by a significant rally. The breakdown scenario has momentum on its side. Twelve consecutive days of ETF outflows, $1.63 billion in liquidations, and a price that’s been making lower highs and lower lows for eight straight weeks.
The FOMC meeting in two weeks is the tiebreaker. What Warsh says about rates will likely determine which scenario plays out. Until then, the market trades on fear, forced selling, and the hope that 12 is close enough to zero.
Disclaimer: This article is for informational purposes only and does not constitute financial advice. Cryptocurrency investments carry significant risk. Always conduct your own research before making any investment decisions.