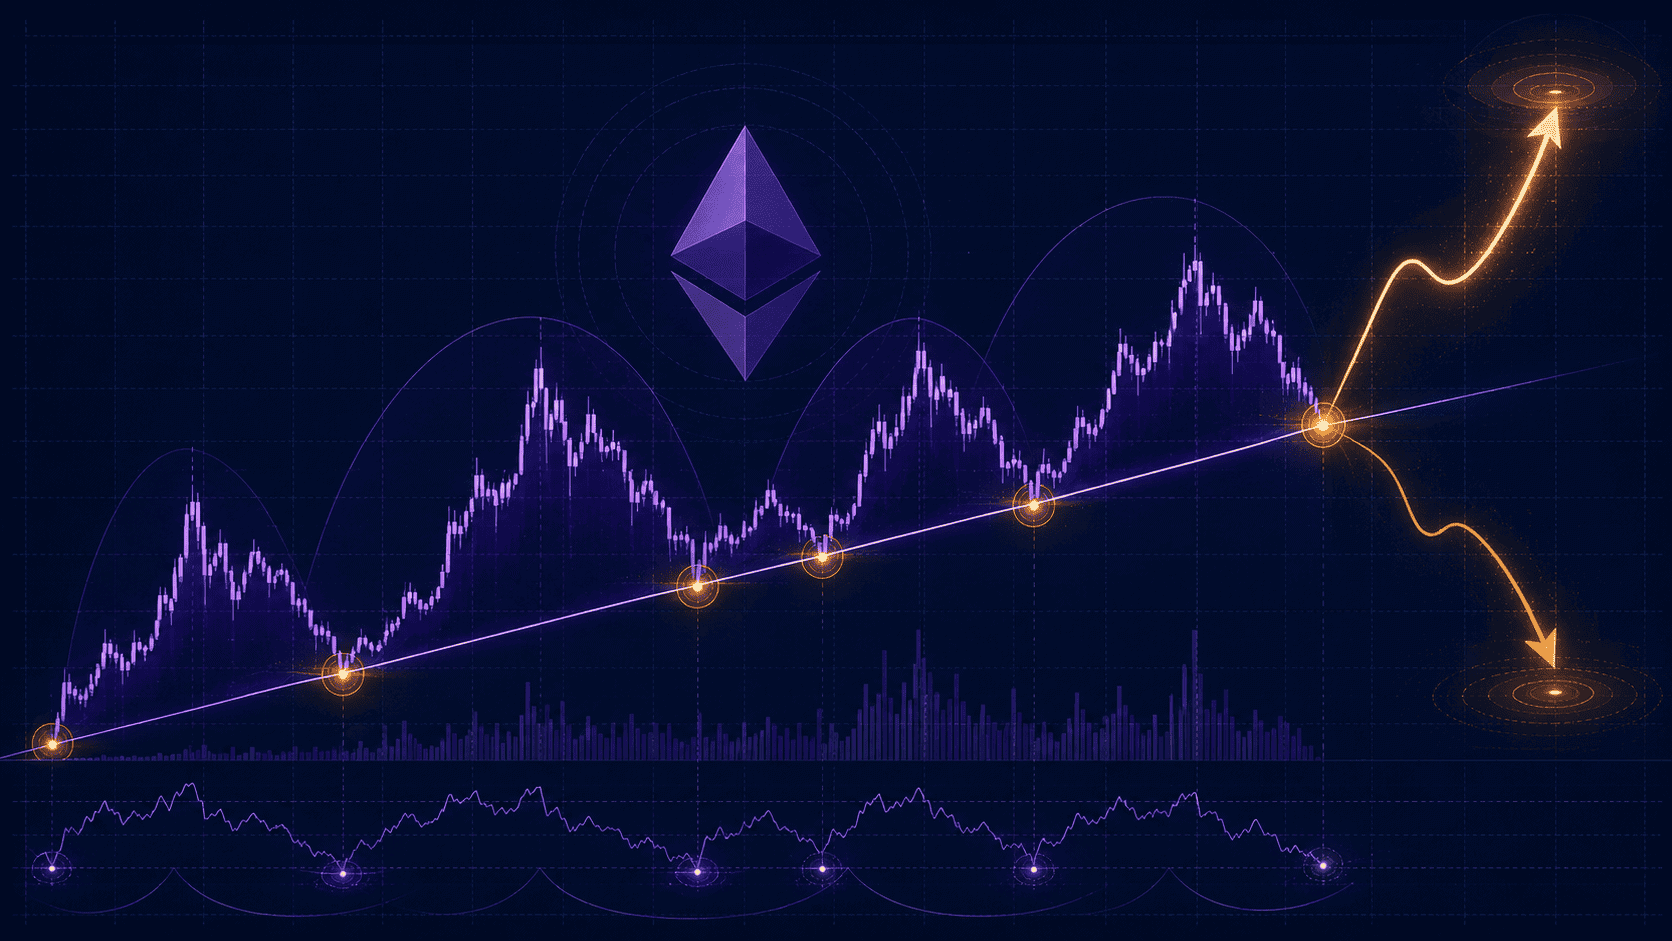
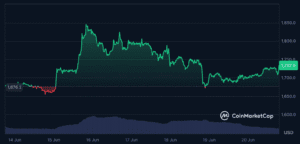
Ethereum sits at $1,687 on Saturday evening after a brutal week. The token broke below $1,700 during Friday’s selloff as the Iran peace deal collapsed at Switzerland’s Bürgenstock resort and the Federal Reserve’s hawkish positioning continued pressuring risk assets. Ethereum is now testing one of the most important technical levels in its multi-year price structure: the long-term ascending support trendline that has marked every major cycle bottom since 2020.
According to crypto analyst Kamran Asghar, Ethereum is making another move on an important rising support trend line that has been responsible for the lows of every major Ethereum move over the past several years. The line connects the COVID crash low of $80 in March 2020, the June 2022 capitulation low near $880, the October 2023 cycle bottom around $1,520, and the recent June 4 low at $1,627. If the pattern holds, the current retest provides one of the strongest contrarian buying opportunities the chart has produced.


If the support holds, technical paths emerge that could take Ethereum toward $6,000 over the next 12-18 months. If the support breaks, the next major level sits at $1,580, with $1,500 representing the deeper technical defence. The next few sessions will determine which interpretation plays out, and the resolution carries significant implications for the broader crypto recovery thesis.
What the Long-Term Support Actually Shows
The ascending trendline that’s being tested has remarkable predictive history. Each previous test of the line has marked an actual cycle bottom rather than just temporary support.
The March 2020 COVID crash drove Ethereum to $80 from approximately $280 a few weeks earlier. The line was tested exactly at that level. The subsequent recovery took ETH from $80 to $4,800 over 19 months, a gain of nearly 6,000%.
The June 2022 capitulation following the Terra Luna collapse and Three Arrows Capital insolvency drove Ethereum to $880. The line was tested precisely at the bottom. The subsequent recovery took ETH from $880 to $4,000 over 22 months, a gain of 350%.
The October 2023 cycle low near $1,520 represented another test of the same trendline. The recovery from that low took Ethereum to $4,953 over 11 months, a gain of 226%.
The current retest at $1,627 (the June 4 low) represents the fourth major test of the line in five years. The pattern of each test marking an actual cycle bottom followed by significant multi-month recoveries provides the technical basis for the bullish thesis. The line has been tested. It has held. The setup either continues the pattern or breaks something fundamental about how Ethereum’s long-term price structure has worked.
Why $1,700 Specifically Matters
The $1,700 level functions as the operational floor that separates the bullish from the bearish technical scenarios.
A daily close above $1,700 with sustained volume would confirm the long-term support is holding. Bulls who positioned during the June 4 retest near $1,627 see their thesis validated. The technical setup for a recovery toward the next major resistance zones at $2,000, $2,300, and eventually $3,000 emerges. The path toward higher long-term targets including $6,000 becomes viable through this scenario.
A daily close below $1,700 with sustained volume would break the immediate support. The next significant level sits at $1,580, where multiple technical indicators converge. Below $1,580, the $1,500 level represents the deeper structural defence. Breaking through $1,500 would invalidate the entire long-term support thesis and open paths toward $1,000, which would represent a 40% additional decline from current levels.
The current price at $1,687 sits in the critical zone between these scenarios. Friday’s close just barely below $1,700 represents the first warning signal but doesn’t yet confirm a breakdown. The next 3-5 trading sessions will reveal which interpretation is correct.
The technical setup is complicated by the broader macro environment. The Federal Reserve’s hawkish positioning, the Iran deal collapse, and the Strategy STRC concerns all create headwinds that didn’t exist during previous successful tests of the long-term support. Whether the technical pattern can hold against these macro forces is the central question.
The Institutional Accumulation Tells a Different Story
While retail sentiment remains pinned in extreme fear (Fear & Greed Index at 14/100), institutional positioning suggests significant accumulation is underway.
Tom Lee’s BitMine purchased $206 million worth of ETH over three days last week, publicly calling the bottom at $1,627. The conviction buying came during exactly the period when retail sentiment was capitulating. BitMine’s positioning reflects institutional research and longer-term thesis rather than momentum-following.
Morgan Stanley filed amended S-1 documents with the SEC for Ethereum and Solana ETFs on June 19, undercutting competitors with a market-leading 0.14% annual management fee. The Morgan Stanley Ethereum ETF (MSSE) will allocate 95% of staking rewards to shareholders, providing yield generation alongside price exposure. The product positioning targets institutional allocation that has been waiting for low-cost staked Ethereum exposure.
Ethereum ETFs broke their 17-day outflow streak earlier this month, the longest in crypto ETF history. The flow reversal alongside the structural infrastructure improvements creates conditions where institutional demand could accelerate as macro conditions stabilise.
The Glamsterdam upgrade continues progressing through testnet phases. The upgrade targets proposer-builder separation for better Layer 1 scaling, block-level access lists, parallel execution, and predictable gas. Each successful testnet milestone advances the timeline toward mainnet deployment that would provide concrete network capability improvements.
BlackRock’s BUIDL fund, JPMorgan’s tokenised settlement infrastructure, and various other institutional integrations on Ethereum continue building structural use cases independent of price action. The fundamental case for ETH has been strengthening even as the price action has disappointed.
What Would Drive the Move to $6,000
The path from current $1,687 levels to $6,000 over 12-18 months would require approximately 255% appreciation. That’s substantial but consistent with previous Ethereum recoveries from similar long-term support tests.
Several specific catalysts could drive this move if the support holds. The Federal Reserve eventually shifting to easing positioning would provide macro support for risk assets including Ethereum. The September 2026 FOMC represents the next opportunity for the Fed to pivot if economic data supports it. Inflation moderation alongside continued growth would create the “soft landing” environment that historically benefits Ethereum more than Bitcoin due to ETH’s higher beta characteristics.
Continued institutional infrastructure expansion would provide structural buying pressure. The Morgan Stanley ETF approval (when it comes), Franklin Templeton’s DRIP ETF launch in September, and ongoing tokenised real-world asset growth on Ethereum all provide sustained institutional demand. If even a modest percentage of these new institutional flows go specifically to Ethereum, the buying pressure compounds over months.
The Glamsterdam upgrade completion would deliver concrete network capability improvements that could trigger appreciation. Previous major Ethereum upgrades (London, Merge, Shanghai, Dencun, Pectra) have each produced meaningful price reactions when their actual implementation delivered the promised improvements. Glamsterdam’s scaling and execution improvements address the network’s most persistent criticisms.
Layer 2 ecosystem maturation matters significantly for Ethereum’s value accrual story. As Layer 2s including Base, Arbitrum, Optimism, and others handle more transaction volume while routing value back to Ethereum through various mechanisms (rollup fees, data availability payments, restaking yields), the structural demand for ETH grows even when on-chain Layer 1 activity remains relatively modest.
The combination of these catalysts, if they materialise, could produce the kind of multi-month rally that previous long-term support tests have produced. The pattern doesn’t guarantee repetition, but the historical evidence and current institutional positioning support the bullish scenario probabilistically.
The Risk to Watch
The bearish scenario also has real foundations that contrarian investors should examine honestly.
Ethereum’s structural value accrual problem persists. The same dynamics that have caused ETH to underperform Bitcoin during 2024-2026 haven’t been fully resolved. Layer 2 networks, stablecoin issuers, and applications continue capturing significant value that previously would have flowed to ETH holders. Whether the Glamsterdam upgrade and continued protocol improvements can reverse this dynamic remains an open question.
Competition from Solana and other Layer 1 alternatives has intensified. Moody’s onchain credit ratings launching on Solana rather than Ethereum sent a meaningful institutional signal. BlackRock, Western Union, State Street, and other major firms have built significant Solana integrations alongside or in some cases instead of Ethereum integrations. Each institutional partnership that goes to competitors rather than Ethereum reduces the structural buying pressure that could support recovery.
If the support breaks decisively at $1,500, the technical setup deteriorates significantly. Levels below $1,500 don’t have strong historical defence points until $1,000 or below. The pattern that has worked at every previous long-term support test would be broken, requiring fundamental reassessment of Ethereum’s price structure.
The Bottom Line
Ethereum at $1,687 sits at one of the most consequential technical levels in its multi-year price structure. The long-term ascending support trendline that has marked every major cycle bottom since 2020 is being tested again. The pattern has worked four times. Whether it works a fifth time will be revealed over the coming sessions.
For long-term investors, the current setup provides asymmetric risk-reward. If the support holds and the historical pattern continues, the path toward $6,000 over 12-18 months represents substantial upside. If the support breaks, the downside to $1,500 or potentially lower is meaningful but bounded.
For traders, the binary nature of the test argues for waiting for confirmation rather than predicting the outcome. A clear daily close above $1,700 with volume would signal the support is holding. A clear close below with volume would confirm the breakdown. Either signal provides clearer positioning than guessing during the current uncertainty.
The line has held four times. It’s being tested for the fifth. The next several days will reveal whether Ethereum’s multi-year structural support remains intact or whether something fundamental has changed about the asset’s price behaviour.
FAQ
What is the long-term support line for Ethereum?
The line is an ascending support trendline that has marked every major Ethereum cycle bottom since 2020. It connects the March 2020 COVID crash low ($80), the June 2022 capitulation low ($880), the October 2023 cycle bottom ($1,520), and the June 2026 low at $1,627. Each previous test has produced significant multi-month rallies, with the smallest recovery (October 2023 to August 2025) returning 226% and the largest (March 2020 to November 2021) returning nearly 6,000%.
What happens if the support breaks?
If Ethereum closes decisively below $1,700, the next significant support sits at $1,580, with $1,500 representing the deeper structural defence. Breaking through $1,500 would invalidate the long-term support thesis entirely and open paths toward $1,000. The breakdown would require fundamental reassessment of Ethereum’s multi-year price structure and would likely extend the bearish phase for several additional months before sustainable recovery becomes possible.
Why is $6,000 a realistic target if support holds?
Each previous successful test of the long-term support has produced recoveries of 226% to 6,000%. A move from current $1,687 to $6,000 represents approximately 255% appreciation, well within the range of historical patterns. The catalysts that could drive this include Federal Reserve easing, continued institutional infrastructure expansion (Morgan Stanley ETF, Franklin Templeton DRIP, RWA growth), Glamsterdam upgrade completion, and Layer 2 ecosystem maturation. The timeline for such a move would likely span 12-18 months based on historical recovery patterns.
Disclaimer: This article is for informational purposes only and does not constitute financial advice. Cryptocurrency investments carry significant risk. Always conduct your own research before making any investment decisions.