
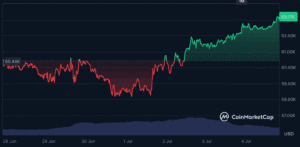
Bitcoin touched $57,750 on the morning of July 2, a 21-month low. Two days later, on July 4, it trades at $63,120, up 1.55% on the day and sitting at its highest level in over a month. That’s a recovery of more than 9% in under 72 hours, and it happened during thin Independence Day trading with US markets closed.
The bounce reversed the brutal end-June losses that had pushed Bitcoin into extreme fear. But the more interesting story isn’t the price. It’s the split underneath it.


Throughout June, two completely different types of buyer moved in opposite directions. Institutions sold. US spot Bitcoin ETFs bled a record $4.06 billion in June, the worst month since the products launched, pushing them into negative territory for 2026 as a whole for the first time. Whales bought. Large holders accumulated more than 270,000 BTC, worth roughly $16.7 billion, over two weeks, with most purchases clustered near the $59,000 level.
That divergence, institutions selling while whales accumulate, is a pattern that has historically appeared near market cycle lows. It doesn’t guarantee the bottom is in. But it means the June selloff wasn’t uniformly bearish. It was a transfer from weaker hands to stronger ones.
What Triggered the Bounce
The immediate catalyst was macroeconomic, not crypto-specific. The US June nonfarm payrolls report showed the economy added just 57,000 jobs, dramatically below the consensus estimate of 110,000 to 129,000. The unemployment rate held flat at 4.2%.
A weak jobs report is now good news for Bitcoin. Cooler hiring lowers the odds that the Federal Reserve raises rates, and lower-for-longer rates make risk assets more attractive. Market-implied odds of a September Fed rate hike fell from roughly 65% to around 50% after the data hit. Bitcoin surged 4% in a single session, outpacing equities, even as the Dow reached a record high.
The move also built on Fed Chair Kevin Warsh’s softer tone earlier in the week. At the ECB forum on July 1, Warsh said inflation risks had come down, offering the first hint of easing after his aggressively hawkish June positioning. The combination of a dovish Fed signal and weak jobs data gave Bitcoin the macro tailwind it needed to reverse.
The lesson worth remembering: crypto is still trading like a leveraged bet on Fed policy, not like “digital gold” that ignores the macro. Anyone building a longer-term view should keep that tether to interest-rate expectations front and center.
The Technical Picture
The recovery has repaired some of the technical damage from June, but Bitcoin still faces real hurdles.
On the positive side, Bitcoin has reclaimed its 20-day and 50-day exponential moving averages and is pressing toward the 100-day EMA. The leveraged long positions that drove June’s cascades have been mostly flushed, with open interest down to roughly $46.5 billion from much higher levels. That matters because it means another sharp drop would likely need a fresh catalyst rather than more forced selling.
The realised profit-to-loss ratio has fallen to its lowest since 2022, a level historically associated with cycle lows. Combined with the extreme fear sentiment (the Fear and Greed Index touched 11 on July 1) and the whale accumulation, several classic bottom signals are aligning.
The levels to watch from here are specific. Immediate resistance sits at the 20-day average near $62,500, which Bitcoin has now cleared, followed by resistance around $63,800. A clean break above $63,800 with volume would suggest the downtrend is over. On the downside, Bitcoin needs to establish $60,000 as support rather than resistance. Below that, $58,000 and then the $56,200 area become the tests. A break below $56,200 would open the $50,000 to $53,000 zone.
The critical structural floor remains the 200-week moving average, which has marked the exact bottom of every major Bitcoin bear market since 2018. Bitcoin’s brief dip to $57,750 tested this region and bounced, which is encouraging for the bottom thesis.
Why the Bounce Might Not Stick
The recovery faces genuine headwinds that traders shouldn’t ignore.
The ETF overhang hasn’t fully resolved. June’s record $4 billion in outflows created structural selling pressure that acts as a ceiling. There was one encouraging sign: spot Bitcoin ETFs snapped a ten-day outflow streak with $221 million in net inflows on July 3, the first positive day after the bleed. But one green day doesn’t make a trend. Citi cut its 12-month ETF inflow forecast to zero, and until flows turn consistently positive, the supply overhang persists.
The AI competition remains a factor. A large portion of the capital that left Bitcoin in 2026 rotated into AI stocks, especially after SpaceX’s blockbuster market debut. If AI equities resume climbing, capital is less likely to rotate back into crypto. There’s a hopeful sign here too: memory and semiconductor stocks have started losing momentum, raising the question of whether capital shifts back toward Bitcoin. But that rotation is far from confirmed.
The options market is skeptical. Bitcoin and ether traders aren’t fully buying the bounce based on positioning in the derivatives market. The recovery has come partly on short covering, and until spot demand confirms the move, some caution is warranted.
Most importantly, the next Fed meeting on July 28-29 looms as the decisive event. Markets give the Fed roughly a 70% chance of holding rates, and the small chance of a move points to a hike, not a cut. Warsh scrapped the practice of hinting at moves in advance, and there won’t be fresh projections until September, so investors walk into that meeting with little to lean on. The mid-July inflation report, following the hot 4.2% May PCE print, could shift the odds beforehand. A cooler reading would strengthen the recovery. A hot one could quickly reverse it.
What Investors Should Take Away
The honest framework is that Bitcoin is showing several genuine bottom signals while still facing unresolved structural pressure.
The arguments for a bottom are real. The realised profit-to-loss ratio at 2022 lows, the EMA reclaims, extreme fear sentiment, the macro tailwind from soft jobs data, and whale accumulation of $16.7 billion all align with historical bottom patterns. Institutions selling while long-term holders absorb the supply is exactly what happens near cycle lows.
The arguments for caution are equally real. The record ETF outflows represent structural selling that hasn’t fully cleared. The CLARITY Act remains stalled in the Senate, suppressing institutional confidence. And crypto’s tight tether to Fed policy means the July 28-29 meeting could reset everything.
For long-term investors, current levels around $63,000 represent significantly better value than the $126,000 October peak, and the whale accumulation provides evidence that sophisticated capital sees value here. For traders, the key signal is whether Bitcoin can turn $60,000 into durable support and break decisively above $63,800. Until then, the bounce remains a recovery attempt rather than a confirmed trend reversal.
Bitcoin has taken the first deep breath after holding it underwater through June. Whether that breath becomes a sustained recovery depends on ETF flows returning, the mid-July inflation data, and what Warsh’s Fed does at month-end. The whales have placed their bet. The rest of the market is still deciding whether to follow.
FAQ
Why did Bitcoin bounce back above $63,000?
The main catalyst was the weak US June jobs report, which showed just 57,000 jobs added versus 110,000-129,000 expected. This cut September Fed rate-hike odds from roughly 65% to 50%, easing a key headwind. The bounce built on Fed Chair Warsh’s July 1 comment that inflation risks had come down. Bitcoin surged from a 21-month low of $57,750 on July 2 to $63,120 by July 4, its highest in over a month.
What is the whale vs ETF divergence?
During June, institutions and whales moved in opposite directions. US spot Bitcoin ETFs saw a record $4.06 billion in outflows, the worst month since launch. Simultaneously, large holders (whales) accumulated more than 270,000 BTC worth $16.7 billion over two weeks, mostly near $59,000. This pattern of institutions selling while long-term holders accumulate has historically appeared near market cycle lows, suggesting a transfer from weaker to stronger hands.
What are the key levels to watch?
Immediate resistance sits at $63,800, and a clean break above it would suggest the downtrend is over. Bitcoin needs to establish $60,000 as support rather than resistance. On the downside, $58,000 and $56,200 are the next tests, with a break below $56,200 opening the $50,000-$53,000 zone. The 200-week moving average, which has marked every major bear market bottom since 2018, sits in the region Bitcoin tested at $57,750. The July 28-29 Fed meeting and mid-July inflation report are the key upcoming catalysts.
Disclaimer: This article is for informational purposes only and does not constitute financial advice. Cryptocurrency investments carry significant risk. Always conduct your own research before making any investment decisions.