


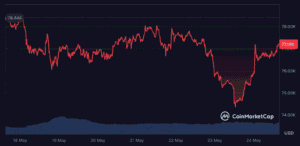
Bitcoin touched $74,300 on Thursday. That was the lowest price since the April selloff and a level that set off alarms across the market. Over $657 million in crypto positions were liquidated in 24 hours. The Fear and Greed Index dropped to 28. Social media is filled with the kind of capitulation posts that usually mark either a bottom or the beginning of something worse.
Then, just as quickly, the price bounced. By Saturday, BTC had climbed back to $76,820, a 1.59% gain over 24 hours, reclaiming territory traders had convinced themselves was lost.


The relief is real. But the relief rally faces some uncomfortable headwinds. Spot Bitcoin ETFs have posted $2.26 billion in outflows over the past two weeks. The 200-day EMA sits at $83,500, well above the current price. And the macro environment, while improving on the geopolitics front, hasn’t delivered the rate cuts that bulls have been counting on.
The bounce looks constructive. But calling it a recovery requires evidence that hasn’t arrived yet.
What Triggered the Drop to $74,300
The selloff wasn’t caused by a single event. It was the result of several negative forces hitting at the same time.
The biggest driver was the reversal in Bitcoin ETF flows. After six consecutive weeks of net inflows that brought in over $3 billion, the tide turned sharply in mid-May. Spot Bitcoin ETFs recorded $1.039 billion in net outflows for the week ending May 15 alone. Combined with the following week’s outflows, the total drain reached $2.26 billion in just two weeks.
When the single largest source of buying pressure reverses course that aggressively, prices follow. ETF outflows remove real Bitcoin from the buy side and put it back on the market. The mechanical impact is the mirror image of what drove prices higher throughout early May.
High-profile sellers added to the pressure. Mark Cuban revealed he sold 80% of his Bitcoin. Harvard dumped its $87 million ETH position. Goldman Sachs exited its XRP and Solana ETF positions. Trump Media moved $205 million in Bitcoin to Crypto.com amid $455 million in unrealized losses. Each headline might not move the market much on its own. Together, they painted a picture of major holders heading for the exits.
The derivatives market amplified the decline. As prices fell below $77,000, leveraged long positions began to be liquidated, forcing additional selling that pushed prices lower still. The cascade took BTC from $77,000 to $74,300 in a matter of hours, with $657 million in total crypto liquidations recorded across the day.
What Caused the Bounce
The recovery from $74,300 back above $76,800 was driven by a combination of improved geopolitics and technical buying at oversold levels.
The most visible catalyst was the US-Iran peace agreement. Negotiations for a 60-day ceasefire and the reopening of strategic oil shipping lanes provided a significant tailwind for risk assets across the board. Oil prices eased. The dollar weakened slightly. And Bitcoin, which has been trading with an 84% correlation to the S&P 500, benefited from the broader improvement in risk appetite.
Technical buyers also stepped in near $74,300, which sits close to the April 12 low of $70,740. That zone represents the range where Bitcoin found support during the worst of the spring sell-off, making it a natural level for buyers who view sub-$75,000 as oversold relative to the asset’s fundamentals.
Short covering added momentum. After the sharp decline, traders who had been betting on further downside started closing their positions to lock in profits. That forced buying pushed prices back above $76,000, giving the market room to stabilize over the weekend.
The Technical Picture Right Now
Bitcoin is sitting in a no-man ‘s-land between clearly defined support and resistance levels.
Support has been established at $74,300, the level that held this week, with the deeper floor at $70,740 from the April low. As long as BTC stays above $74,000, the overall structure remains one of higher lows since February’s $60,000 bottom. That’s technically constructive even if it doesn’t feel great.
Resistance is stacked overhead. The first barrier sits at $78,000, roughly where Bitcoin stalled before this week’s decline. Above that, $80,000 remains a psychological level that BTC has struggled to hold consistently. The 50-day EMA near $76,716 is currently being tested. And the 200-day EMA at $83,513 represents the long-term trend line that Bitcoin needs to reclaim before anyone can credibly call this a recovery.
The RSI rebounded from oversold territory during the dip, a pattern that historically precedes at least a short-term bounce. But the MACD on the daily chart remains in bearish territory, suggesting that the broader downtrend from the January highs hasn’t reversed yet.
For traders, the range to watch is $74,000 to $80,000. A weekly close above $80,000 would be the first meaningful sign of recovery. A breakdown below $74,000 would put the $70,000 level back in play and likely trigger another wave of liquidations.
The ETF Problem That Hasn’t Gone Away
The elephant in the room is the reversal in ETF flows. During the first two weeks of May, Bitcoin ETFs were the engine that kept BTC above $80,000. When those flows turned negative, the price followed almost immediately.
The two-week outflow total of $2.26 billion is significant not just for its size but for what it represents: institutional investors actively reducing their Bitcoin exposure. These aren’t retail traders panic-selling. These are wealth managers, pension fund allocators, and institutional portfolios making calculated decisions to trim their positions.
The reasons behind the outflows likely include portfolio rebalancing after Bitcoin’s Q1 recovery, rotation into other asset classes such as gold (which hit $5,000) and AI stocks, and a response to the deteriorating technical picture as BTC fell below key moving averages.
For Bitcoin to sustain a recovery above $77,000, ETF flows need to stabilize at a minimum and ideally return to net positive territory. Without that institutional bid, the market lacks the consistent buying pressure needed to push through the multiple resistance levels sitting between current prices and $85,000.
Next week’s flow data will be critical. If outflows continue at the same pace, expect another test of $74,000. If they stabilize or reverse, the bounce could build into something more meaningful.
The Macro Setup Has Actually Improved
Here’s the part of the story that gives bulls some genuine hope.
The US-Iran peace agreement, while fragile, has reduced one of the biggest sources of market uncertainty in 2026. The Strait of Hormuz shipping crisis had been weighing on risk assets for months. A 60-day ceasefire doesn’t solve everything, but it provides breathing room for markets to refocus on fundamentals rather than geopolitical fear.
The ARMA bill introduced this week proposes buying up to 1 million Bitcoin for a Strategic Reserve. Whether it passes is uncertain, but the mere existence of legislation directing the Treasury to accumulate BTC at scale sends a powerful signal about the direction of US policy.
Trump’s executive order directing the Fed to open payment systems to crypto companies, the CLARITY Act advancing through the Senate, and Kevin Warsh’s installation as the most crypto-friendly Fed Chair in history all create a regulatory backdrop that’s more supportive than at any previous point in Bitcoin’s existence.
The disconnect between Washington’s increasingly bullish posture and the market’s bearish price action is one of the most interesting dynamics in crypto right now. Policy is moving in Bitcoin’s favor faster than the price is reflecting it. That gap has historically resolved to the upside, but the timing remains unpredictable.
Relief Rally or Real Recovery
The honest answer is that it’s too early to tell.
A relief rally bounces from oversold conditions, reclaims some lost ground, and then fades as the underlying selling pressure reasserts itself. The price drifts back down and either retests the low or makes a new one.
A real recovery breaks through resistance levels with rising volume, reclaims key moving averages, and attracts fresh buying that wasn’t present before. The structure shifts from lower highs to higher highs, and the market begins to build momentum rather than just recover from panic.
Right now, Bitcoin’s bounce from $74,300 to $76,820 looks more like the former than the latter. The move came on weekend volume, which tends to be thinner and less reliable than weekday activity. The price hasn’t reclaimed $78,000, let alone $80,000. And the ETF outflow trend that caused the decline hasn’t shown signs of reversing.
That doesn’t mean a recovery can’t develop from here. But it needs confirmation. The checklist is straightforward: reclaim $78,000, then $80,000. See ETF flows stabilize. Watch the Fear and Greed Index climb back above 40. If those boxes get checked over the coming week, the bounce has legs. If they don’t, this is a dead cat bounce in a continuing downtrend.
For long-term holders, the sub-$77,000 range has historically been a zone where patient accumulation pays off over 12 to 24-month horizons. For traders, the risk-reward favors waiting for confirmation rather than front-running a recovery that hasn’t proven itself yet.
FAQ
How low did Bitcoin drop this week?
Bitcoin hit $74,300 on Thursday, May 22, its lowest level since the April selloff. The decline was triggered by $2.26 billion in ETF outflows over two weeks, high-profile sellers including Mark Cuban and Harvard, and cascading liquidations that wiped out $657 million in leveraged positions across the crypto market.
What caused the bounce back to $77,000?
The recovery was driven by the US-Iran peace agreement improving risk appetite, technical buying at the $74,300 support level, and short covering from traders who had been betting on further downside. Bitcoin climbed back to $76,820 by Saturday, a 1.59% gain in 24 hours.
Is this a real recovery or a temporary bounce?
It’s too early to confirm. A real recovery requires Bitcoin to reclaim $78,000 and then $80,000, see ETF outflows stabilize, and show improving momentum indicators. Until those conditions are met, the bounce from $74,300 is best treated as a relief rally from oversold conditions rather than the start of a sustained uptrend.
Disclaimer: This article is for informational purposes only and does not constitute financial advice. Cryptocurrency investments carry significant risk. Always conduct your own research before making any investment decisions.