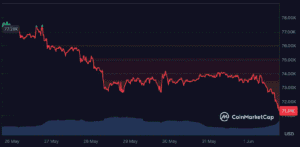
Bitcoin opened at $73,568. By mid-morning, it was at $71,400. A $2,100 slide in a few hours, dragging the world’s largest cryptocurrency to its lowest level since the February crash.
The trigger was a single SEC filing. Strategy, the company that holds more Bitcoin than any corporation on the planet, confirmed it sold 32 BTC last week to fund dividend payments. The first sale in four years. The amount was tiny. The symbolism was enormous. We’ll cover the full Strategy story in a separate article. What matters for this piece is how the sale affected Bitcoin’s price and where BTC goes from here.


Everything That Was Supporting Bitcoin Has Crumbled in 30 Days
Rewind to early May. Bitcoin was trading above $82,000. Spot ETFs were pulling in hundreds of millions per week. The ARMA bill proposed buying a million Bitcoin for a Strategic Reserve. Trump signed an executive order pushing the Fed to open payment systems to crypto. Kevin Warsh, a Fed Chair with $100 million in personal crypto, had just been sworn in.
The policy backdrop was the best in Bitcoin’s history. The price fell 15% in a straight line.
Here’s what happened between then and now. Spot Bitcoin ETFs posted a record nine consecutive days of outflows totaling $2.8 billion. May ended with $2.4 billion in net outflows, the worst month since the ETFs launched. Mark Cuban sold 80% of his Bitcoin. Harvard dumped its entire crypto allocation. Goldman Sachs cut positions. US airstrikes on Iran crashed the market below $73,000. And now, Strategy, the company that built its entire identity around never selling, has just sold.
Each of these events individually would have rattled the market. Together, in the same month, they’ve stripped away every narrative that was holding Bitcoin above $75,000.
The institutional bid is gone. The “never sell” corporate floor is gone. The geopolitical peace dividend is gone. What’s left is a market trading on fear, with the Fear and Greed Index stuck at 25 for nearly five weeks.
The $70,000 Level Is Now the Only Thing Standing Between Here and $65,000
Let’s talk about the chart because that’s what matters right now.
Bitcoin is trading at approximately $71,400. It’s below every single major moving average. The 20-, 50-, and 100-day EMAs cluster in the $76,400 to $76,700 zone, roughly $5,000 above the current price. The 200-day EMA sits even higher at $81,500. To put it simply, BTC would need to rally 14% just to reclaim its long-term trend line.
The RSI has dropped to 35, approaching oversold territory. That’s the zone where selling momentum typically starts to weaken, and buyers begin stepping in. In previous cycles, RSI readings near 30-35 have coincided with short-term bounces. But “oversold” doesn’t mean “can’t go lower.” It means the rubber band is stretched. It can stretch further before it snaps back.
Support sits at $70,000 to $70,740, the April low that represented the deepest point of the spring correction. That level held in April because ETF inflows were still positive and institutional sentiment hadn’t fully collapsed. Both of those conditions have changed. If $70,000 breaks this time, the cushion that caught it last time isn’t there.
Below $70,000, the next meaningful support doesn’t appear until $65,000 to $68,000. A decline to that zone would represent a 48% drawdown from the October 2025 all-time high of $126,198. That’s within the range of previous cycle corrections, so it wouldn’t be unprecedented. But it would be painful for everyone who bought at or above $75,000, including Strategy, whose average cost basis is $75,699.
The Divergence Between Stocks and Crypto Has Never Been This Wide
Here’s the detail that makes the current selloff genuinely unusual rather than just another crypto correction.
The S&P 500 is near all-time highs above 7,200. The Nasdaq has been pushing records all month on the back of AI stocks. NVIDIA, Microsoft, Alphabet, and Meta are all trading at or near their peaks. Traditional risk assets are thriving.
Bitcoin is at a six-week low.
For most of 2026, Bitcoin traded with an 80%+ correlation to the S&P 500. When stocks went up, crypto went up. When stocks went down, crypto went down. That relationship gave bulls confidence, as the equity bull market provided a tailwind for crypto.
That correlation has shattered. Stocks are rallying while Bitcoin drops. The two markets have completely decoupled, and it’s happening in the worst possible direction for crypto holders.
The reason is straightforward: institutional investors are choosing AI over crypto. The money leaving Bitcoin ETFs isn’t going to cash. It’s going to Nvidia, to semiconductor ETFs, to AI infrastructure plays that are delivering real earnings growth. When a portfolio manager has to decide between an asset class down 15% with record outflows and an asset class up 25% with record earnings, the choice is obvious.
Bitcoin’s problem isn’t that risk appetite is dead. Risk appetite is alive and well in equities. Bitcoin’s problem is that it’s losing the competition for institutional capital to an AI boom that shows no signs of slowing down.
What Actually Needs to Happen for Bitcoin to Recover
Forget the predictions and the narratives for a moment. Here’s what Bitcoin concretely needs to change the trend.
ETF flows must reverse. This is non-negotiable. The single largest source of institutional buying pressure has been in retreat for three weeks. Until daily flow data show consistent net inflows returning, the structural selling pressure will continue regardless of what else happens.
The Iran situation must be resolved. Every escalation in the Strait of Hormuz sends oil prices higher, fuels inflation, pushes rate-cut expectations further into the future, and gives risk-averse investors another reason to avoid crypto. A signed, enforced peace deal that actually reopens shipping would be the most powerful single catalyst available. Diplomatic drafts and ceasefire announcements haven’t been enough. The market needs ships moving through the strait without being charged Bitcoin tolls.
Fed Chair Warsh must signal rate cuts. The FOMC meeting on June 17-18 is the most important date on the calendar. If Warsh surprises with dovish language that opens the door to cuts later this year, risk assets across the board would rally, and institutional capital would rotate back toward higher-beta plays, including crypto. If he signals that rates will stay higher for longer, the sell-off deepens.
And BTC must reclaim $76,500. That’s where the 20, 50, and 100-day EMAs cluster. Trading below all of them simultaneously defines a bearish trend. Pushing back above them doesn’t guarantee a recovery, but nothing meaningful happens until that zone is recaptured.
All four of these conditions would need to materialize. Any single one could trigger a bounce. All four together could trigger a rally back toward $85,000. None of them has materialized yet.
The Long-Term Holders Aren’t Panicking. Should You?
There’s one data point in this entire mess that argues against despair.
Long-term Bitcoin holders, wallets that haven’t moved their coins in at least 155 days, now control approximately 15.8 million BTC. That’s a record high. It means the people with the longest time horizons and strongest convictions are not selling into this weakness. They’re accumulating.
That pattern has repeated at every major bottom in Bitcoin’s history. Short-term traders panic, sell, and move to cash or equities. Institutional ETF flows reverse as portfolio managers rebalance. Headlines turn negative. The Fear and Greed Index drops to extreme levels. And through it all, the long-term holders quietly buy what everyone else is dumping.
The December 2022 cycle bottom happened with a similar setup: maximum fear, institutional capitulation, and long-term holders accumulating. Bitcoin was at $16,000 then. It reached $126,000 within two years.
That doesn’t mean $71,400 is the bottom. It could go lower. The $70,000 support could break. The correction could extend to $65,000. But the people who have been through multiple cycles and held through drawdowns of 50%, 70%, even 80% are telling you with their wallets that they believe current prices are worth buying.
Whether you agree with them depends on your time horizon. If you need Bitcoin to recover next week, you’re in trouble. If you can hold for 12 to 24 months, the long-term holders’ track record is worth considering. They’ve been right at every major turning point in Bitcoin’s history. They’ve never been wrong together.
That doesn’t guarantee they’re right this time. But it’s the strongest contrarian signal in the market.
The Road Through June
June is historically one of Bitcoin’s more neutral months, with a slight positive bias in median returns. But this June carries more catalysts than any single month in recent memory.
The FOMC meeting on June 17-18 will set the tone for the second half of the year. The CLARITY Act faces over 100 amendments in the Senate. The SpaceX IPO, expected in June, could shift attention and capital flows across both equity and crypto markets. And the Iran peace talks are scheduled to resume on June 5, with the potential to either ease or intensify the energy crisis that has been weighing on risk assets.
Each of these events can move Bitcoin 5% to 10% on its own. If they align positively, a recovery to $78,000-$80,000 by month-end is realistic. If they align negatively, a $65,000 test becomes the base case.
At $71,400 with an RSI near 35 and long-term holders at record accumulation levels, Bitcoin is oversold and under-loved. That combination has historically produced the best entry points for patient investors. It has also produced the most painful extensions for traders who called the bottom too early.
The market doesn’t care about your timeline. It moves when the catalysts arrive. And in June 2026, those catalysts are loaded and approaching fast.
FAQ
Where is Bitcoin trading right now?
Bitcoin fell to approximately $71,400 on Monday, June 1, 2026, down from an opening price of $73,568. The drop was triggered by Strategy’s SEC filing, which confirmed its first Bitcoin sale since 2022. BTC is now 43% below its all-time high of $126,198 and trading below every major moving average.
What are the key support levels to watch?
Immediate support sits at $70,000 to $70,740, the April low. If that level breaks, the next major support is $65,000 to $68,000. On the upside, the EMA cluster at $76,400 to $76,700 is the first resistance zone that Bitcoin must reclaim to change the bearish trend. The 200-day EMA at $81,500 is the long-term trend line.
Is this a buying opportunity or the start of a bigger crash?
Long-term holder supply is at a record 15.8 million BTC, which has historically coincided with cycle bottoms. The RSI is approaching oversold territory. But ETF outflows are at record levels, stocks are dramatically outperforming crypto, and multiple macro risks remain unresolved. The June 17-18 FOMC meeting, the Iran peace talks on June 5, and progress on the CLARITY Act will likely determine whether the current level marks a bottom or a waypoint toward lower prices.
Disclaimer: This article is for informational purposes only and does not constitute financial advice. Cryptocurrency investments carry significant risk. Always conduct your own research before making any investment decisions.