
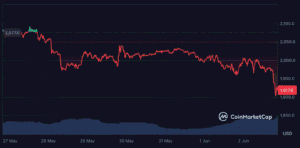
Ethereum is trading at approximately $1,930 on Tuesday afternoon. The second-largest cryptocurrency dropped below $2,000 for the second time in five days, and this time the breach came with more force, more volume, and worse context than the first.
Bitcoin’s collapse to $70,000 after Iran suspended peace talks pulled the entire market down. But Ethereum’s decline isn’t just collateral damage from Bitcoin’s selloff. ETH has its own problems, and they’ve been getting worse every week.


Spot Ethereum ETFs recorded $401.62 million in net outflows during May, the third-largest monthly drain since these products launched. The daily outflow streak has now extended to 12 consecutive sessions. Over 60 whale wallets holding at least 10,000 ETH have reduced or completely exited their positions over the past two months. And May closed 12.6% in the red, breaking a streak where the same month delivered gains of 24.7% in 2024 and 41.1% in 2025.
The $2,000 psychological level that held through three separate tests in late May has now failed twice. The second failure is always worse than the first because it tells the market that buyers who defended the level last time aren’t strong enough to do it again.
The ETF Outflows Are Relentless
The numbers paint a picture of institutional investors methodically reducing their Ethereum exposure with no sign of stopping.
May’s $401.62 million in outflows ranks as the third-worst month on record for spot ETH ETFs, behind only November 2025 ($1.42 billion) and December 2025 ($616.82 million). The peak single-day outflow hit $121.4 million on May 28, with BlackRock’s ETHA product accounting for roughly $80 million of that total.
The correlation between ETF flows and ETH’s monthly price performance has been almost mechanical throughout 2026. March saw near-neutral outflows of $46 million, and ETH closed up 7.07%. April flipped to $356 million in net inflows, and ETH gained 7.38%. May reversed to deep outflows, and the price collapsed 12.6%.
The pattern is clear enough that it barely needs analysis. When institutions buy, ETH goes up. When they sell, ETH goes down. And they’ve been selling for 12 straight days with no sign of a reversal.
The question everyone is asking is why the outflows are so persistent. The answer involves multiple factors working simultaneously. Hot CPI inflation at 3.8% has pushed rate cut expectations further into the future, making yield-free assets like ETH less attractive. AI stocks continue outperforming crypto by wide margins, giving institutional allocators a better alternative. The Iran conflict continues to suppress risk appetite. And Ethereum’s own competitive challenges, losing DEX dominance to Solana, watching eight senior researchers leave the Foundation, failing to see the Glamsterdam upgrade translate into price gains, all undermine the case for increasing ETH exposure.
The Whale Picture Is Split Down the Middle
The on-chain data reveals a market that’s genuinely divided between two groups of large holders making opposite decisions.
On the selling side, more than 60 whale wallets holding 10,000+ ETH have either fully exited or significantly reduced their positions over the past two months. Harvard sold its $87 million allocation. Garrett Jin deposited $1.35 billion to Binance. Goldman Sachs cut its ETH exposure. These aren’t small traders getting scared. These are sophisticated holders making deliberate portfolio decisions.
On the buying side, whale wallets, excluding exchange addresses, added 1.02 million ETH in May, pushing aggregate holdings from 124.15 million to 125.17 million ETH. That’s over $2 billion in accumulation during a month when the price dropped 12.6%. Somebody with deep pockets is buying what the institutions are dumping.
Glassnode’s Hodler Net Position Change metric, which tracks mid- to long-term holder behavior, has remained positive continuously since February 24. That’s notable because the only stretch in 2026 where the hodler metric turned negative was February, when ETH fell 19.6%. The current selloff hasn’t shaken long-term holders the way the February crash did.
The divergence between institutional ETF selling and whale on-chain accumulation creates a tug-of-war that must eventually be resolved. Either the institutions stop selling, and whale accumulation drives a recovery, or ETF outflows overwhelm the whales, and the price goes lower. Right now, the institutions are winning.
$2,000 Has Flipped From Support to Resistance
This is the technical detail that matters most to anyone holding ETH or considering buying.
For three weeks in late May, the $2,000 level functioned as support. Every time ETH dipped near it, buyers stepped in and pushed the price back above. The level held through three separate tests before finally breaking on May 28 during the Iran airstrikes crash.
ETH briefly recovered above $2,000 over the weekend. Then on Tuesday, it dropped through again. The second failure is the one that changes the chart’s character. A level that functions as support, breaks once, recovers, and then breaks again has officially flipped to resistance. Now $2,000 is the ceiling that ETH needs to push back through, not the floor it falls to.
Above $2,000, Glassnode data shows two dense resistance clusters. Approximately 1.37 million ETH sits at cost basis between $2,059 and $2,075. Another 1.24 million ETH clusters around $2,154-$2,170. These are holders who bought at those levels and have been sitting on losses. As the price approaches their entry points, they’ll look to sell at breakeven, creating mechanical resistance.
Below current prices, CoinDCX identifies $1,964 as the next support. If that breaks, the path opens toward $1,850 and potentially $1,545, a level that would represent a 69% decline from the all-time high and the deepest correction since the 2022 bear market.
June Is Historically Ethereum’s Worst Month
The seasonal data adds another layer of concern. June has historically been ETH’s weakest calendar month, with negative median returns across multiple market cycles.
May was supposed to offset that seasonal weakness. Instead, May delivered a 12.6% loss. Entering June already below $2,000, with ETF outflows accelerating, whale selling ongoing, and the Iran conflict unresolved, the seasonal headwind compounds an already difficult picture.
The fundamental argument for a June recovery centers on two potential catalysts. The FOMC meeting on June 17-18 could yield dovish signals from Fed Chair Warsh, improving risk appetite. And the CLARITY Act’s progress through the Senate could unlock the institutional ETF demand that Standard Chartered’s $4 to $8 billion inflow projection depends on.
Without at least one of those catalysts materializing, the seasonal and flow data both point lower. ETH entered June with negative momentum, negative sentiment, and a Fear and Greed Index at 23. That’s the worst starting position for any June in Ethereum’s recent history.
The Bull Case That Won’t Die
Despite everything, there are reasons why a group of sophisticated investors keeps buying below $2,000.
BlackRock is building tokenized fund products on Ethereum. The Glamsterdam upgrade tripled the gas limit. The network has 189.5 million wallet holders, more than three times Bitcoin’s. Over 66% of the supply is locked in staking. Exchange reserves are at yearly lows. Tokenized real-world assets on Ethereum exceed $8 billion. And Standard Chartered still has a $4,000 year-end target with a $40,000 projection for 2030.
The whale accumulation data suggest that buyers with multi-year time horizons view current prices as a discount relative to where Ethereum will eventually trade. The 1.02 million ETH accumulated in May, worth over $2 billion, represents conviction-level buying from wallets that have historically been right at major turning points.
But being right eventually and being right on time are different things. The whales who accumulated at $1,800 in February were vindicated when ETH rallied to $2,400 in April. The whales who accumulated at $2,000 in late May are currently underwater, with the price at $1,930. Long-term conviction doesn’t protect you from short-term pain.
For retail investors, the decision comes down to time horizon. If you’re buying ETH today, you’re betting that $1,930 looks cheap 12 to 24 months from now and that the institutional outflows eventually reverse. The fundamental case supports that bet. The near-term flow data does not. Both things can be true simultaneously. The question is how much short-term pain you’re prepared to absorb while waiting for the long-term thesis to play out.
FAQ
Why did Ethereum fall below $2,000 again?
Bitcoin’s crash below $70,000 after Iran suspended peace talks pulled ETH down. But Ethereum’s decline also reflects its own problems: $401 million in ETF outflows in May, a 12-day streak of daily outflows, 60+ whale wallets reducing or exiting positions, and the $2,000 support level failing for the second time in five days.
What are the key support levels below $2,000?
Immediate support sits at $1,964. If that breaks, the next major zone is $1,850. Below that, CoinDCX identifies $1,545 as the downside target if bearish momentum continues. On the upside, $2,000 has now flipped to resistance, with dense supply clusters at $2,059 to $2,075 (1.37M ETH) and $2,154 to $2,170 (1.24M ETH).
Are whales buying or selling Ethereum?
Both. Over 60 whale wallets with 10,000+ ETH have reduced or exited positions since April. Harvard, Goldman Sachs, and Garrett Jin all sold. But whale wallets, excluding exchanges, accumulated 1.02 million ETH ($2 billion) in May. Long-term holder metrics have stayed positive since February 24. The market is split between institutions selling through ETFs and conviction buyers accumulating on-chain.
Disclaimer: This article is for informational purposes only and does not constitute financial advice. Cryptocurrency investments carry significant risk. Always conduct your own research before making any investment decisions.