

Dogecoin trades near $0.090 after recovering roughly 10% from its 2 September low of $0.0817, holding a narrow corridor between $0.089 and $0.091 following a brief touch of $0.092.
The token sits above its 200-day simple moving average at $0.0884, which had been resistance through much of August and now functions as the nearest support.


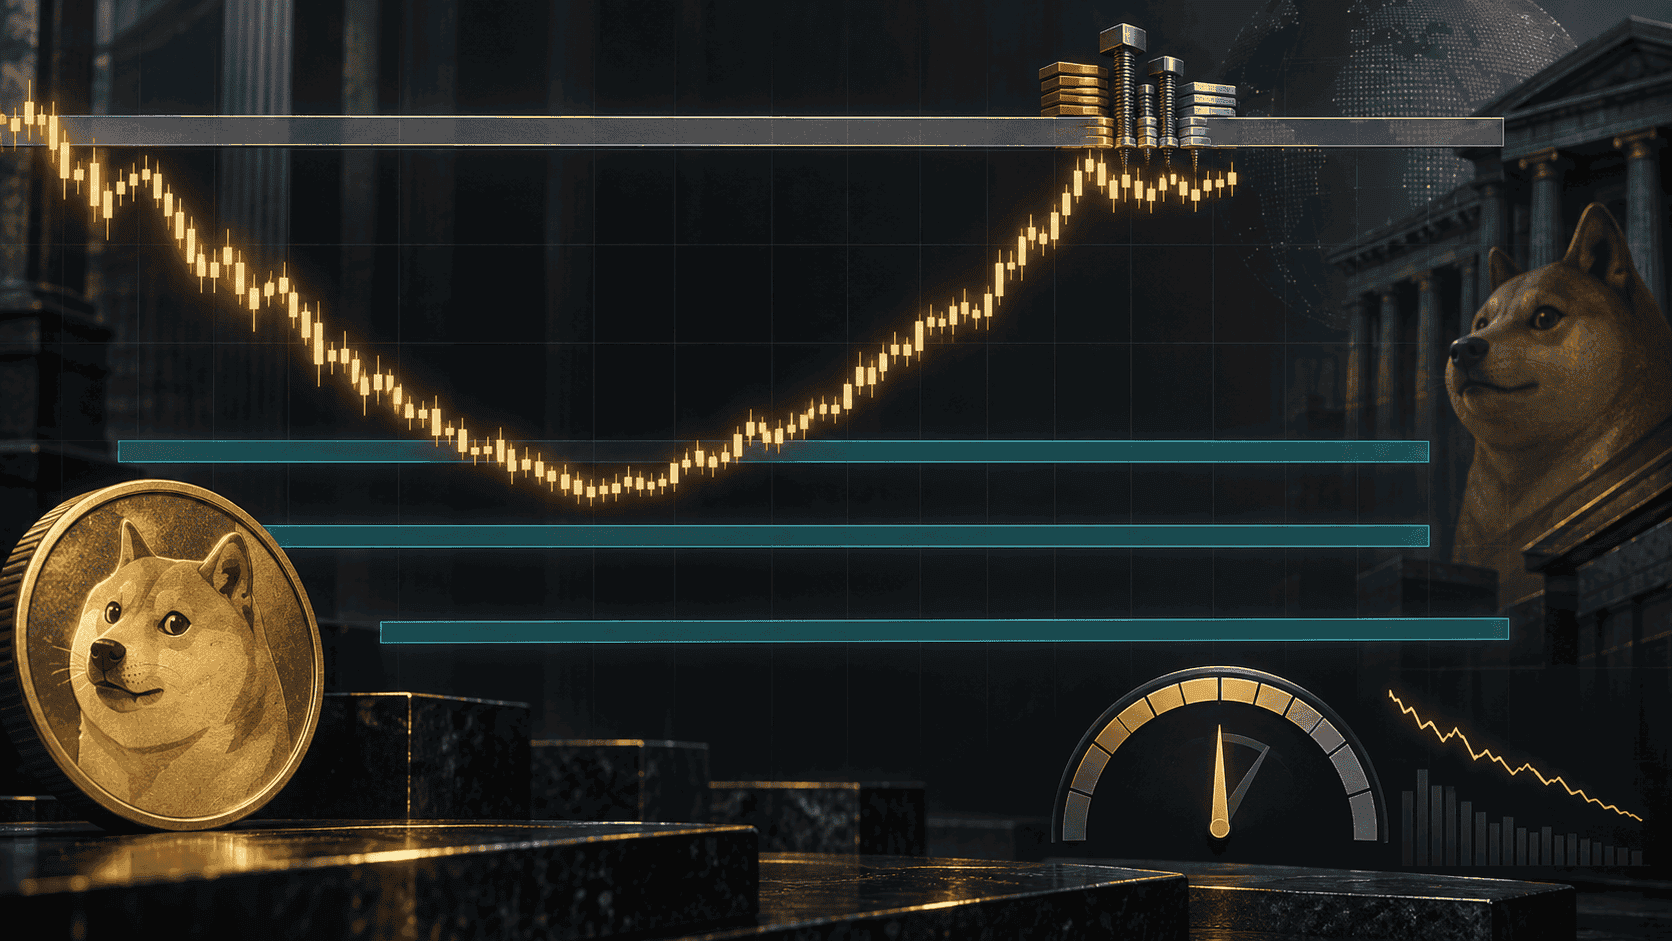
A cup and handle pattern has formed on the four-hour chart, a structure that typically signals accumulation followed by controlled consolidation beneath resistance.
The pattern is textbook. Whether it resolves upward is a different question, and the momentum data currently argues against it.
The resistance band is where the leverage sits
The level that matters is $0.092 to $0.0926, and it matters for a specific reason.
That band coincides with the heaviest concentration of leveraged positions on the chart. Clusters of liquidation levels behave in two ways: they can accelerate a breakout as short positions are forced to close and buy back, or they can act as a ceiling where traders take profit.
Analyst Trader Tardigrade, who identified the cup and handle formation, was explicit about the condition. A convincing break above the handle’s trendline, accompanied by increased volume and sustained momentum, could carry DOGE toward $0.10. Without that confirmation, he expects the token to remain range-bound and potentially retest lower support.
Clearing the band opens $0.0965, then the psychological $0.10 level.
Momentum is fading before the test
The indicators do not support an imminent breakout, which is the tension in the setup.
The Relative Strength Index reads 54, still favouring buyers, but the RSI line sits below its signal line. That gap points to weakening upward momentum rather than building pressure, and it is not the reading you want ahead of a resistance test.
Bollinger Bands are narrowing, indicating consolidation is the more likely near-term outcome than an immediate directional move.
The four-hour Chaikin Money Flow reads minus 0.05, showing moderately negative capital flow despite spot buying pressure exceeding selling. That divergence, positive spot activity against negative flow metrics, describes a market where buyers are present but not committing size.
Downside supports run in sequence: the 200-day SMA at $0.0884, the 20-day SMA at $0.0871, and the four-hour Supertrend at $0.0847.
The bigger picture is a triangle apex
The four-hour pattern sits inside a much larger structure that has been building since late 2024.
DOGE opened September at approximately $0.0817, almost exactly at the apex of a triangle where a descending resistance line from the $0.48 high meets a shallower support trend extending back to early 2024.
That convergence is why the current range matters beyond a few cents. A close above $0.087, which DOGE has now achieved, opens a path toward $0.10. A break below $0.080 risks a drop to $0.068.
Analyst Ali Martinez has separately noted that the $0.0813 zone contains nearly 35 billion DOGE in prior transaction volume, making it a substantial floor. Whales accumulated more than 400 million DOGE over a recent five-day period.
Martinez also delivered less welcome news. The old $15 Dogecoin target rested on a rising parallel channel that had defined DOGE since launch, with every touch of its lower boundary marking a major buying opportunity, including gains of 9,221% in 2017 and 30,694% in 2020. DOGE has since broken below that channel, removing the technical basis for that thesis entirely.
ETF demand has stalled
The institutional side offers little support at present.
DOGE-focused exchange-traded funds recorded $343,580 in net outflows between 31 August and 4 September, breaking a two-week streak of positive inflows.
The absolute figure is small, but the direction matters more than the size for an asset where ETF demand has been thin throughout. Dogecoin has fallen roughly 39% across 2026, and weak ETF appetite has been a consistent feature of that decline.
Derivatives data is similarly ambivalent. DOGE derivatives volume climbed 17.46% to $1.13 billion over a recent 24-hour period while open interest slipped 1.64% to $1.27 billion, meaning part of that volume was traders exiting rather than new money arriving.
What decides it
The near-term framework is narrow.
DOGE needs a decisive break above $0.092 to $0.0926 on expanding volume to confirm the cup and handle and open $0.0965, then $0.10. Failing there sends it back toward $0.0884, then $0.0871.
The wider structure is what carries more weight. Holding above $0.080 keeps the triangle intact. Losing it exposes $0.068.
Macro will likely determine which happens. Bitcoin trades near $78,800 with Brent crude above $100 after strikes on tankers, and rate-hike expectations have been building into the Federal Reserve’s 16 September decision. August producer prices arrive Thursday and consumer prices Friday.
DOGE is among the highest-beta assets in crypto. A soft inflation print would likely carry it through $0.092 without much resistance. A hot one makes the $0.0884 support the more relevant level.
FAQ
What is the key resistance?
The $0.092 to $0.0926 band, which contains the heaviest concentration of leveraged positions. Clearing it on strong volume would confirm the cup and handle pattern and open $0.0965, then $0.10.
Is the pattern bullish?
The structure is, but momentum is not confirming it. RSI reads 54 with the line below its signal line, indicating weakening upward momentum, while Bollinger Bands are narrowing and four-hour Chaikin Money Flow sits at minus 0.05.
What is the downside?
Support runs at the 200-day SMA at $0.0884, the 20-day SMA at $0.0871, and the Supertrend at $0.0847. Below the wider triangle support at $0.080, the next level is $0.068.
Disclaimer: This article is for informational purposes only and does not constitute financial advice. Cryptocurrency investments carry significant risk. Always conduct your own research before making any investment decisions.