

XRP trades around $1.38 after cooling from a late-August high near $1.70, and the chart has narrowed to a single question.
The token has formed a descending triangle since that rally, with lower highs pressing down on a flat floor. That floor sits between $1.35 and $1.38, and it is where the next move gets decided.


The level matters for two reasons that happen to coincide.
Why $1.35 carries so much weight
Analyst Ali Charts identified the $1.35 to $1.38 zone as one of the most significant demand levels on the chart, noting that roughly 3.2 billion XRP previously changed hands in that exact range. A separate reading from the same analyst put the figure closer to 4.8 billion XRP bought between $1.31 and $1.38.
Either way, a very large number of holders have their cost basis right where the price is sitting. Those buyers tend to defend a level rather than sell into it.
The 200-day exponential moving average also sits around $1.35, which makes it the technical line separating a recovery from a breakdown on the longer timeframe.
Holding it keeps the Q3 reversal structure intact. Losing it exposes the $1.20 to $1.29 area, with the 50-day EMA near $1.21 as the next obvious stop.
The upside path is unusually well mapped
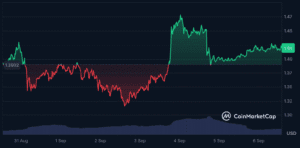
The descending triangle’s resistance sits near $1.55, and a daily close above it would be the first genuine signal the pattern has broken upward rather than down.
Above that, the levels stack in sequence. Resistance at $1.60 and $1.68, both of which held nearly 2 billion XRP each in prior demand, then $1.86 as the breakout point Ali Charts flagged. Clearing $1.86 would open a path toward $2.19.
The nearer hurdle is $1.43. Bulls need to reclaim that before $1.55 becomes relevant.
Liquidation data adds a second dimension. CoinGlass shows concentrations near $1.35, $1.38, and between $1.44 and $1.50. Those clusters cut both ways: they can accelerate a rebound by forcing short positions to close, or act as resistance if traders use the same levels to take profit.
The Parabolic SAR remains above price at $1.6852, indicating sellers still control the short-term trend.
ETF demand is telling a different story to the chart
The most interesting divergence in XRP right now is between price and flows.
US spot XRP ETFs recorded $110.49 million in net inflows during the week ending 28 August, their strongest week of 2026 and the first time weekly flows crossed $100 million since December. Cumulative net inflows have reached roughly $1.79 billion.
That is genuine institutional buying arriving while the spot price slid roughly 8% over the same week.
The picture has since cooled. XRP ETF inflows fell about 83% in the week ending 5 September, dropping to $19 million from $110.5 million, as institutional appetite rotated back toward bitcoin. Bitcoin ETFs took $986.9 million over the same period.
Flows remain positive, but the surge has faded. Whether weekly inflows return above $100 million is one of the clearer signals to watch for the rest of the month.
The daily Chaikin Money Flow reading stood at 0.09, above zero, indicating net buying pressure over its 20-day window despite the price drop.
The escrow unlock is less dramatic than it sounds
Ripple released 1 billion XRP from escrow on 1 September under its monthly mechanism, and the number tends to generate more alarm than it warrants.
Ripple has historically returned a large share of released tokens straight back into escrow. The scheduled unlock does not automatically translate into that full amount reaching the open market, and the release itself is routine rather than discretionary.
That said, uncertainty over how much eventually gets sold is a genuine overhang, particularly if it coincides with weak seasonality.
September has no reliable pattern
The historical record offers less guidance than usual.
XRP has posted seven positive and seven negative Septembers since 2013, an exact coin flip. The average return is a healthy +12.7%, but the median is slightly negative at -0.28%.
That gap is explained by a handful of outlier rallies, including +94.4% in September 2013 and +73.2% in September 2018, which pull the average upward without describing a typical month.
Anyone citing XRP’s average September return as a reason for optimism is quoting a number distorted by two events more than a decade ago.
What decides it
The framework is narrow.
Holding $1.35 to $1.38 keeps the August structure alive and leaves $1.43, then $1.55, as the levels to reclaim. A daily close above $1.55 would break the descending triangle upward and put $1.60, $1.68 and $1.86 in play.
Losing $1.35 confirms the triangle breaking lower and exposes $1.20 to $1.29.
A death cross remains on the moving averages, a reminder that the medium-term trend has not fully turned despite August’s rally.
The wider market matters more than any XRP-specific factor. Bitcoin fell below $80,000 on Friday after a stronger-than-expected US payrolls print raised the odds of a September rate increase. Consumer price index data lands on 11 September, with the Federal Reserve meeting on 15 and 16 September.
XRP is a higher-beta asset. If the inflation print supports a hold, it would likely outperform. If it does not, $1.35 gets tested quickly.
FAQ
Why is $1.35 the key level?
Roughly 3.2 to 4.8 billion XRP was bought in the $1.31 to $1.38 range, making it a major demand zone, and the 200-day moving average sits at the same point. Losing it exposes $1.20 to $1.29.
Are ETF inflows still strong?
They have cooled sharply. Weekly inflows fell about 83% to $19 million in the week ending 5 September, down from $110.49 million the previous week, though cumulative inflows remain around $1.79 billion.
Does the 1 billion XRP unlock matter?
Less than the number suggests. Ripple historically returns a large share of released tokens to escrow, so the full amount does not reach the open market.
Disclaimer: This article is for informational purposes only and does not constitute financial advice. Cryptocurrency investments carry significant risk. Always conduct your own research before making any investment decisions.