


Ethereum opened at $2,507.70 on Friday, 4.9% above Thursday’s opening price, then traded between roughly $2,453 and $2,522 through the morning session.
The move followed comments from Federal Reserve Governor Chris Waller, who said he is focused on next week’s inflation report to determine whether he supports holding rates steady or raising them. Bitcoin opened at $81,271.92 on the same news, its highest since 12 May, and recorded its largest ETF inflow in nine months.


Ethereum’s market capitalisation sits near $233 billion, second behind bitcoin’s roughly $1.33 trillion.
The rally is welcome for holders but leaves ETH in an unresolved position. It is trading directly on the level that determines whether August’s breakout was structural or another failed attempt.
The August move was different
Ethereum spent almost a year trapped beneath a descending trendline that had capped every rally since the August 2025 peak of $4,953.73.
Two weeks ago it broke through, printing a weekly candle worth more than 31% and producing the first higher high of this cycle. Earlier breakout attempts had failed to deliver that, which is what makes the move technically significant rather than simply large.
The June low added weight to the case. It landed inside a demand zone between $1,600 and $1,760 that had previously absorbed selling in June 2023, October 2023 and April 2025.
Confirmation of that breakout now depends on a single level.
$2,438 is the line
Price is testing the 0.618 Fibonacci retracement at $2,438.85 as support.
A weekly close above it opens the 0.5 retracement at $2,919.89 as the next objective, roughly 19% higher, and strengthens the broader altcoin case.
Losing it exposes the Supertrend near $2,220. Below that sits the psychological $2,000 level, which ETH broke down from on 2 June.
The 20-day exponential moving average at $2,307 provides intermediate support between those points.
Bulls therefore need a weekly close above $2,438. That is the entire near-term question, and Friday’s rally has ETH sitting on it rather than clearly above it.
Two rejections at the 50-week average
The ceiling is equally well defined and has already held twice.
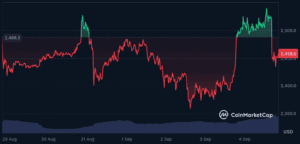
The 50-week moving average sits at $2,542, and ETH has failed at $2,534 on two separate attempts. Analyst Ted Pillows noted on 31 August that Ethereum tried to break above $2,550 and failed again, adding that he expects more sideways movement and a small capitulation before a genuine reversal. He marks $2,200 as first support and $2,800 as the next resistance zone.
Reclaiming $2,484 is the immediate requirement to void the breakdown from earlier in the week. Price has set a lower high after those two failures at $2,534, which is a bearish structural detail regardless of Friday’s percentage gain.
The immediate trading range is bounded by $2,400 support and $2,500 resistance. A daily close above $2,565 would signal a genuine bullish breakout. A sustained break below the 78.6% retracement at $2,340 could trigger a deeper pullback toward $2,164.
Momentum is cooling
The indicators have turned before the price has, which is the tension in the current setup.
The daily MACD completed a bearish crossover, with the line at 140.4 beneath the signal at 143.1 and the histogram negative at -2.7. The RSI has fallen out of overbought territory to 63.3, and volume expanded roughly 70% on a down session.
Falling out of overbought is not itself bearish. It removes the timing risk that applied when ETH was pressing $2,534 with stretched momentum, which arguably improves the entry for anyone building a position gradually.
But a completed bearish MACD crossover on the daily chart, combined with a lower high, means Friday’s move has to be sustained rather than assumed. One strong session does not reverse a momentum signal.
One whale is heavily exposed
Positioning adds a specific level worth tracking.
A whale recently opened a 10x long position in Ethereum worth $102.3 million, with a liquidation price of $2,241. Several trading firms hold sizeable short exposure against it.
That liquidation price sits just above the Supertrend at $2,220 and below the 20-day EMA at $2,307. If ETH loses $2,438 and works down toward that zone, the forced closure of a position that size would add selling into an already weak tape.
It cuts the other way too. Concentrated short exposure means an upside break through $2,542 could force covering.
Three catalysts in eleven days
The macro calendar dominates the near term, and Waller’s comments made that explicit.
The August jobs report lands today. If it shows modest but stable growth, expectations for steady rates strengthen, which would support both bitcoin and ethereum.
The August Consumer Price Index arrives on 11 September and is the report Waller specifically identified as decisive for his vote. The Federal Reserve then meets on 15 and 16 September.
Ethereum-specific catalysts are thinner. The Glamsterdam upgrade has slipped again to the fourth quarter of 2026, with the Sepolia testnet fork proposed for late September. That timeline offers little support inside the current window.
Institutional demand has been the more relevant driver. Persistent spot ETF inflows, led by BlackRock, absorbed over $1.4 billion during one recent nine-day stretch, and ETH funds have continued taking money on days when bitcoin products recorded outflows.
What to watch
The framework for the next week is narrow and testable.
A weekly close above $2,438.85 preserves the August breakout and puts $2,919.89 in play. A weekly close below it invalidates the structure and exposes $2,220, then $2,000.
Above, $2,542 is the level that has rejected ETH twice. Clearing it on a daily close above $2,565 would be the first genuine confirmation that the ceiling has broken.
Between those two numbers, Ethereum is consolidating rather than trending, and the CPI print on 11 September is more likely to resolve it than anything on the chart.
FAQ
Why did ETH rise on Friday?
Ethereum opened at $2,507.70, up 4.9% from Thursday, after Fed Governor Chris Waller said he is focused on next week’s inflation report in deciding whether to hold or raise rates. Bitcoin opened at its highest level since 12 May on the same comments and recorded its largest ETF inflow in nine months.
What is the significance of $2,438?
It is the 0.618 Fibonacci retracement level and the point that determines whether August’s breakout holds. A weekly close above opens the 0.5 retracement at $2,919.89, roughly 19% higher. Losing it exposes the Supertrend near $2,220 and then the $2,000 level.
What is capping the upside?
The 50-week moving average at $2,542. Ethereum has failed at $2,534 twice, setting a lower high. A daily close above $2,565 would signal a genuine breakout, while reclaiming $2,484 is the immediate requirement to void the recent breakdown.
Disclaimer: This article is for informational purposes only and does not constitute financial advice. Cryptocurrency investments carry significant risk. Always conduct your own research before making any investment decisions.